
- Title
-
Systematic discovery of novel ciliary genes through functional genomics in the zebrafish
- Authors
- Choksi, S.P., Babu, D., Lau, D., Yu, X., Roy, S.
- Source
- Full text @ Development
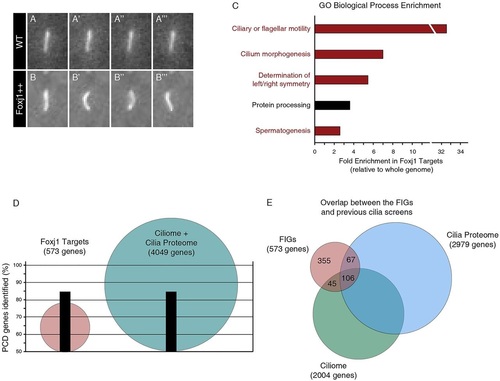
Foxj1 upregulates known ciliogenic and ciliopathic genes. (A-B′′′) Sequential stills from movies of a Tg(actinb2::Arl13b-GFP) transgenic embryo showing (A-A′′′) an immotile primary cilium on a wild-type muscle cell (WT) and (B-B′′′) an ectopic motile cilium on a muscle cell of an Tg(actinb2::Arl13b-GFP; hsp70::foxj1a) embryo that overexpressed Foxj1 (Foxj1++). (C) GO annotation enrichment for the human orthologs of the Foxj1 target genes relative to the human genome. Of the top five enriched categories, four are directly related to cilia motility or morphogenesis (red). The other enriched GO category may be indirectly related to cilia (black). Categories are overlapping; however, redundant categories were not duplicated (see Materials and Methods). (D) The Foxj1 target genes are more efficient at identifying known PCD-causing genes than the ciliome and the cilia proteome combined. Although it contains fewer than 600 mammalian genes, the list of Foxj1 targets (red) contains 84.6% of PCD genes. By comparison, the ciliome and the cilia proteome together consist of 4049 genes (blue) and identify the same percentage of the known PCD genes as the Foxj1 targets. (E) There is little overlap between the FIGs (red) and the cilia proteome (blue) or the ciliome (green). PHENOTYPE:
|
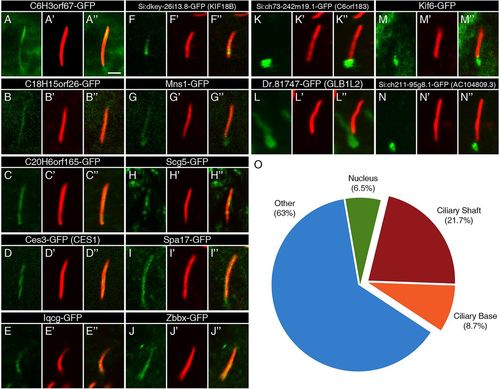
Ciliary localization of FIG-encoded proteins in the zebrafish embryo. (A-N) The localization of GFP-tagged FIG-encoded proteins relative to motile cilia of the KV (green) in 13-14hpf embryos. The GFP signal was amplified with anti-GFP antibodies. (A2-N2) Ciliary axonemes were labeled with anti-acetylated tubulin antibodies (red). (A3-N3) Overlays of the two channels show the overlap between the gene products and the ciliary shafts. Scale bar: 2μm. (O) An overview of the localization of the FIG gene products shows that the majority does not localize to the cilium. These genes may encode cytoplasmic, membrane or nuclear regulators of cilia function. |
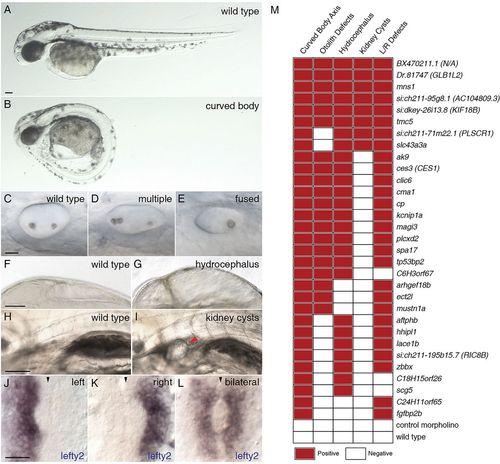
Morpholino knockdown of FIGs causes multiple ciliary dysfunction-associated phenotypes in zebrafish embryos. Five ciliary phenotypes were scored in the zebrafish embryos injected with morpholinos targeting the 50 selected FIGs. The extent of body axis curvature: (A) wild type or (B) curved body. Otolith defects in the inner ear: (C) two otoliths, (D) greater than two otholiths or (E) a single otolith. Swelling of the brain ventricles (hydrocephalus): (F) normal or (G) hydrocephalus. Kidney cysts: (H) no cysts or (I) a minimum of one cyst per embryo. Expression of lefty2: (J) leftward expression, (K) rightward expression or (L) bilateral expression or no expression (data not shown). The red arrowhead indicates the position of a kidney cyst (I); the black arrowheads indicate the midline (J-L). Scale bars: 100μm in A,F,H; 20μm in C,J. (M) Morpholino knockdowns of 31 genes exhibited defects in at least two of the assayed phenotypes. For morphological phenotypes, each square represents at least 60 assayed embryos from two independent injections. For left-right asymmetry defects, each square represents a minimum of 30 stained and scored embryos. A red square indicates that the morphant phenotype level was significantly different from the wild type and met a minimum defective percentage (see Materials and Methods). PHENOTYPE:
|
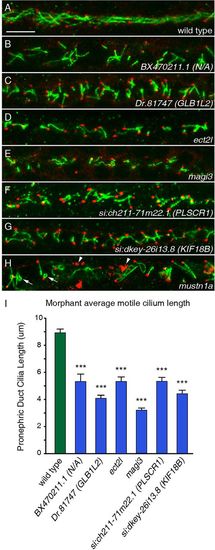
FIGs are required for both ciliogenesis and cilia organization. (A-H) Cilia of the pronephric duct were stained with anti-Arl13b antibodies (green) and the basal bodies were stained with antibodies to γ-tubulin (red) in 24hpf embryos. (A) Long cilia of uniform length and orientation are visible in a wild-type embryo. (B-G) Six morphants exhibited shortening of pronephric cilia at 24hpf. (H) The knockdown of mustn1a caused curling of cilia (arrows) and a disorganization of the γ-tubulin (arrowheads). Scale bar: 10μm. (I) Measurements of ciliary length in wild-type versus morphant embryos for six genes reveals the extent of ciliary shortening in the morphants. Error bars represent s.e.m. ***P<5.0×10⁷ (Student′s t-test, two-tailed, P-values are listed in supplementary material Table S3); n≥30. PHENOTYPE:
|
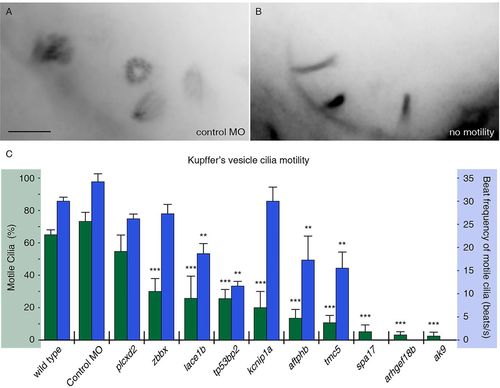
FIGs are required for ciliary motility. (A,B) Embryos were injected with RNA encoding Arl13b-GFP to label KV cilia and imaged using high framerate video microscopy. (A) An overlay of 20 frames from a movie from a control embryo indicates four moving cilia in view. (B) By comparison, overlays from movies of an embryo with immotile cilia show no blurring, indicating stationary objects. Scale bar: 5μm. (C) Measurements of ciliary motility in wild-type and morphant embryos targeting ten selected genes. Two aspects of ciliary motility were scored: the percentage of KV cilia that exhibited motility (green) and the average beat frequency of motile cilia (blue). Error bars represent s.e.m. ***P<4.0×10⁷ (Fisher′s Exact test, two-tailed; P-values are listed in supplementary material Table S3). **P<5.0×10³ (Student′s t-test, two-tailed, P-values are listed in supplementary material Table S3). The three genes without reported ciliary beat frequency did not have sufficient motile cilia for analysis (n<8). PHENOTYPE:
|
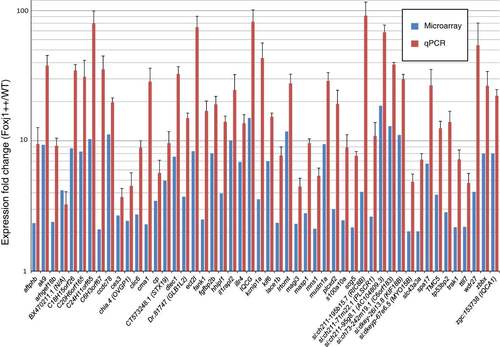
FIGs are enriched in embryos overexpressing Foxj1 as measured by microarray analysis and RT-qPCR. Fifty three genes were selected randomly from the set of genes up-regulated by Foxj1 as determined by microarray analysis. The induction of 50 of these genes was confirmed using reverse transcription and quantitative (RT-qPCR) to compare transcript levels in embryos overexpressing Foxj1 to wild type embryos. These 50 genes showed a substantial increase in expression in response to Foxj1 overexpression. Blue bars indicate the expression fold change as measured by microarray analysis while red bars indicate expression changes measured by RT-qPCR. The y-axis is in a logarithmic scale (log10), error bars are standard errors of the mean. All results are significant by a Student’s t-test (p < 0.05). EXPRESSION / LABELING:
|
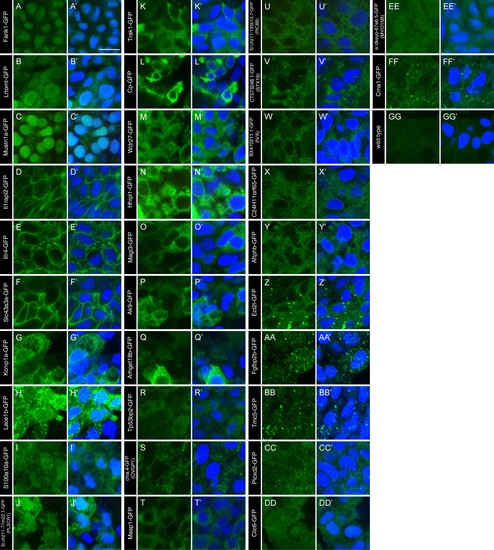
Localization of non-ciliary FIG-encoded proteins in zebrafish embryos. (A-GG) The localization of GFP-tagged FIG-encoded proteins in cells surrounding KV of 13-14 hpf embryos. The GFP signal was amplified with anti- GFP antibodies (green). (GG) Uninjected wild type embryos were stained and imaged under comparable conditions as controls. (A′-GG′) Nuclei were labelled with DAPI (blue) and the overlay of the two channels show the overlap between the gene products and the nuclei, if any exists. Images are grouped by similar localization patterns. The scale bar in A′ represents 10 μm. |