
Fig. S3
- ID
- ZDB-FIG-150911-21
- Publication
- Choksi et al., 2014 - Systematic discovery of novel ciliary genes through functional genomics in the zebrafish
- Other Figures
- All Figure Page
- Back to All Figure Page
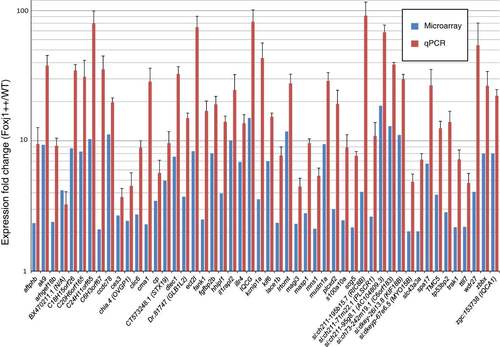
FIGs are enriched in embryos overexpressing Foxj1 as measured by microarray analysis and RT-qPCR. Fifty three genes were selected randomly from the set of genes up-regulated by Foxj1 as determined by microarray analysis. The induction of 50 of these genes was confirmed using reverse transcription and quantitative (RT-qPCR) to compare transcript levels in embryos overexpressing Foxj1 to wild type embryos. These 50 genes showed a substantial increase in expression in response to Foxj1 overexpression. Blue bars indicate the expression fold change as measured by microarray analysis while red bars indicate expression changes measured by RT-qPCR. The y-axis is in a logarithmic scale (log10), error bars are standard errors of the mean. All results are significant by a Student’s t-test (p < 0.05). |