
- Title
-
Differentiation of zebrafish melanophores depends on transcription factors AP2 alpha and AP2 epsilon
- Authors
- Van Otterloo, E., Li, W., Bonde, G., Day, K.M., Hsu, M.Y., and Cornell, R.A.
- Source
- Full text @ PLoS Genet.
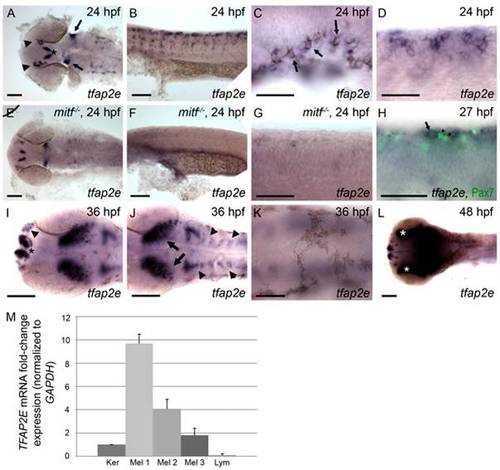
Characterization of tfap2e expression during embryogenesis. Wild-type zebrafish embryos, unless otherwise indicated, fixed at the stage indicated and processed to reveal tfap2e expression by RNA in situ hybridization. All embryos in this and subsequent figures are oriented with anterior to the left. (A) Dorsal view of the head showing tfap2e expression in presumed olfactory placode (arrowheads), medial telencephelon (asterisk), and hindbrain (arrows). (B) Lateral view of the trunk, showing tfap2e expression in cells migrating from the dorsal neural tube. (C) Lateral view just caudal to the ear. tfap2e expression is seen in newly-pigmented melanophores (arrows). (D) Higher-magnification view of the tfap2e-expressing cells of the trunk that are shown in panel B. (E–G) tfap2e expression in mitfab692 homozygous mutant embryos, in (E) dorsal and (F,G) lateral views. E) Expression of tfap2e in the head is virtually normal, (F, G) while its expression in the trunk is virtually absent. (H) Lateral view of a wild-type embryo processed to reveal tfap2e mRNA and Pax7 protein, a marker of xanthophores. tfap2e expression (arrow) does not overlap with α-Pax7 immunoreactivity (arrowheads). (I,J) Dorsal head views. I) At 36 hpf, tfap2e expression is visible in the olfactory placode (arrowheads in I), in bilateral clusters in the telencephalon (asterisk); J) in the optic tectum (arrows), and in rhombomeres (arrowheads in J). K, L) Dorsal views of the head. K) At 36 hpf expression of tfap2e in melanophores is no longer detectable. L) At 48 hpf tfap2e expression is detected in the retina (asterisks). (M) Quantitative RT-PCR shows that expression of TFAP2E in 3 independent primary human melanocytes (Mel 1–3) is about 2–10 fold higher than in keratinocytes (Ker), while its expression in Jurkat cells (lymphocytes, Lym) is about 10 fold lower than in keratinocytes. Scale bars: (A, B, E, F, H, I, K), 100 μm; (C, D, G, J), 50 μm. |

Expression of kita in melanophores is dependent on Tfap2a and Tfap2e. (A) Top, schematic of the tfap2e gene, showing the target sites of the MOs used in this study; middle, schematic indicating the effects of the tfap2e e3i3 MO on the tfap2e transcript (Roman numerals refer to exons, other numbers refer to amino acids). TA, transactivation domain. DBD, DNA binding domain. The e2i2 MO overlaps the exon 2 splice donor site, the e3i3 MO overlaps the exon 3 splice donor site, and the AUG MO overlaps the translation start site, as indicated in red. P1 and P2 are the primers used for RT-PCR. tfap2e e3i3 causes precise deletion of exon 3, leading to a frame shift and premature stop codon near the beginning of exon 4. Bottom right, Ethidium bromide-stained gel of PCR products generated from cDNA harvested from tfap2e e3i3 MO injected embryos at the indicted stages. The MO has largely lost efficacy by 72 hpf. (B–G) Lateral views of embryos processed to reveal kita expression. (B,C) At 30 hpf, kita expression is readily detected in the dorsum of B) a sibling embryo but not C) a tfap2a mutant. (D, E) At 36 hpf kita expression is detectable in discrete cells in the dorsum of D) sibling embryos (arrows), E) tfap2a mutants (arrows), and F) sibling embryos injected with tfap2e MO, but is undetectable in G), the dorsum of tfap2a mutants injected with a tfap2e MO; kita expression is still detected in the cloaca of this last group (arrow). MOs are co-injected with p53 MO in this and subsequent figures, to prevent cell death in the nervous system (see text). B) Scale bars: 100 μM (applies to B–G). |
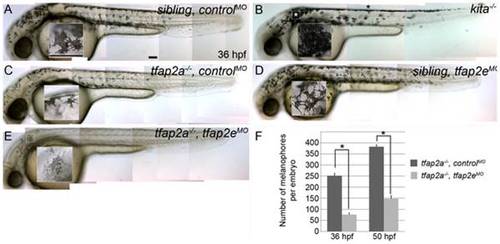
tfap2e morpholino has no effect in wild-type embryos, but disrupts melanophore differentiation in tfap2a mutants. (A–E) Lateral views of live embryos at 36 hpf. (A) A sibling embryo injected with a negative control MO (controlMO), with normal melanophores. (B) A kitab5 homozygous mutant, in which melanophores remain in the trunk dorsum (black asterisk) and near the otic vesicle (white asterisk), but are normally melanized. (C) A tfap2ats213 homozygous mutant injected with a control MO (tfap2a-/-,controlMO), exhibiting fewer melanophores than siblings and wild type embryos. (D) A sibling embryo injected with tfap2e e3i3 MO (tfap2eMO), with melanophores that are normal with respect to both number and differentiation. The pictured melanophore appears to be more spindly than control counterparts, but this was not a reproducible effect. (E) A tfap2e MO-injected, presumed tfap2a mutant embryo (tfap2a-/-/tfap2eMO), showing fewer melanin-producing melanophores than in tfap2a mutants (82 of 312 injected embryos from an incross of heterozygous tfap2a mutant fish resembled the pictured embryo). (F) Histogram presenting the average number (± standard error, SE) of pigmented melanophores per tfap2a-/-/controlMO and tfap2a-/-/tfap2eMO embryo at 36 hpf and 50 hpf. n = 10 embryos, asterisks indicate a p value <0.05. Scale bars: 100 μm. PHENOTYPE:
|
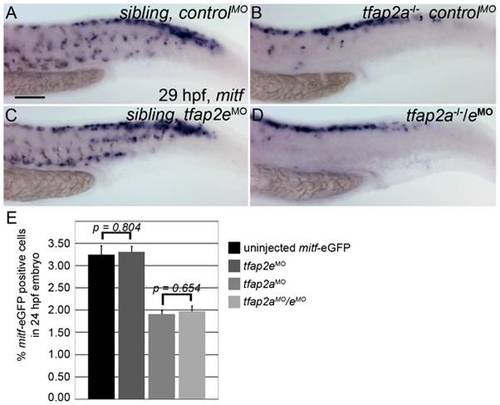
Numbers of mitfa-expressing cells are equivalent in tfap2a/e doubly-deficient and tfap2a deficient embryos. (A–D) Lateral trunk views of 29 hpf embryos of the indicated genotypes, injected with either control MO or tfap2e e3i3 MO, as indicated, and processed to reveal mitfa expression. Relative to the sibling embryo shown in (A), the tfap2a-/- mutant embryo injected with a control MO (B) clearly has fewer cells expressing mitfa. (C) A tfap2eMO injected sibling embryo, with normal number of Imitfa expressing cell numbers. (D) A tfap2a-/-/eMO embryo. The number of mitfa expressing cells is similar to that seen in tfap2a-/- mutants (N = 10 embryos, tfap2a-/- 287.2±5.8, tfap2a-/-/eMO 275.4±6.1, p = 0.18). The loss of mitf-expressing cells in tfap2a-/- and tfap2a-/-/eMO embryos is particularly prominent in the ventral portion of the tail. (E) Counts of GFP-expressing cells, scored by FACS, in dissociated 24 hpf mitfa:GFP transgenic embryos that were uninjected, injected with tfap2a MO, tfap2eMO, or tfap2a/eMO, as indicated. Numbers indicate the average (±SE) percentage of the GFP-expressing cells at 24 hpf; p values from a Student t-test are indicated. Bars one and two compare the percentage of mitfa-EGFP-positive cells from 24 hpf uninjected mitfa-EGFP transgenic embryos (n>50 embryos, 3 independent repeats) and 24 hpf tfap2eMO embryos (n>50 embryos, 3 independent repeats). Bars three and four compare the percentage of mitfa-EGFP-positive cells from 24 hpf tfap2aMO embryos (n>50 embryos, 3 independent repeats) and 24 hpf tfap2aMO/eMO embryos (n>50 embryos, 3 independent repeats). Student t-test analysis indicates that there is no significant difference between the numbers of mitfa-EGFP-positive cells in tfap2a-deficient embryos and tfap2a/e-deficient embryos (p = 0.65). (A) Scale bar, 100 μm, applies to all panels. |
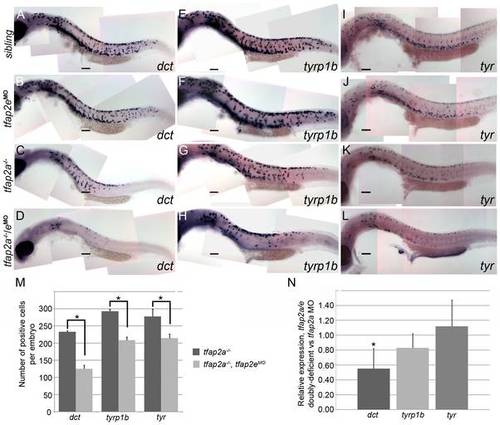
tfap2a/e doubly-deficient embryos have defects in melanophore differentiation. (A–L) Lateral views of 29 hpf embryos processed to reveal (A–D) dct, (E–H) tyrp1b, and (I–L) tyr expression. (A, E, I) Sibling embryos have greater numbers of cells expressing these markers than do (C, G, K) tfap2a mutants; (D, H, L) in tfap2a-/-/eMO embryos a further reduction is apparent. This enhanced reduction is most apparent for dct expression. (B, F, J) Sibling embryos injected with the tfap2e MO resemble uninjected sibling embryos. Scale bars: 100 μm. (M) Histogram showing average number of dct-positive, tyrp1b-positive, and tyr-positive cells in the whole embryo at 29 hpf. First pair of bars, dct-positive cells in uninjected tfap2a-/- embryos (n = 10 embryos), vs. in tfap2a-/-/eMO embryos (n = 20 embryos); second pair of bars, tyrp1b-positive cells in the uninjected tfap2a-/- embryos (n = 10 embryos) vs. in tfap2a-/-/eMO embryos (n = 20 embryos). Final pair of bars, tyr-positive cells in uninjected tfap2-/- embryos (n = 10 embryos) vs. in tfap2a-/-/eMO embryos (n = 10 embryos). Student t-test analyses indicate that the differences among cells expressing the indicated markers are statistically significant for tfap2a-deficient embryos vs. tfap2a/e-deficient embryos (for dct, p = 1.4×10⁻⁹; for tyrp1b, p = 1.5×10⁻⁸; for tyr, p = 0.02). (N) mRNA expression levels of differentiation markers in cells sorted from mitf:egfp embryos injected with the tfap2a/e MO (normalized to β-actin) relative to those in cells sorted from embryos injected with the tfap2a MO alone (normalized to β-actin) (* = p<0.05). |
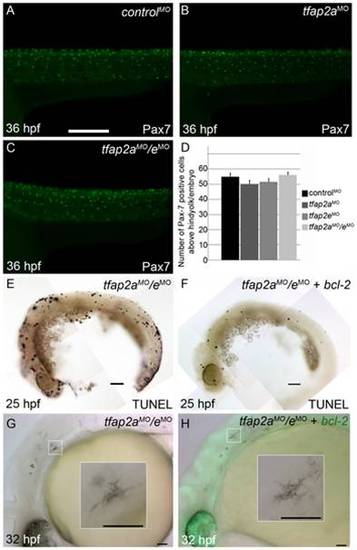
Contribution of cell fate specification and cell death to melanophore defects in tfap2a/e doubly-deficient embryos. (A–C) Lateral views of 36 hpf embryos stained with α-Pax7 to mark xanthophores. A similar number of α-Pax-7 IR positive cells is apparent in wild-type embryos injected with (A) a control MO, (B) the tfap2a MO, and (C) the tfap2a MO/tfap2e MO. (D) Average values for the number of α-Pax-7 IR positive cells counted above the hind yolk, n = 10 embryos per group. (E, F) Lateral views of 25 hpf embryos processed with the TUNEL reaction. (E) In an embryo injected with tfap2a/e MO alone there are many more TUNEL-positive cells than in (F) an embryo co-injected with an mRNA encoding a bcl2-gfp mRNA. (This effect was quantified in a parallel experiment, in which bcl2GFP mRNA was co-injected with control MO, embryos fixed at 24 hpf, and the number of TUNEL-positive cells counted: control MO, 97.7±15.5; control MO + bcl2-gfp 54.4±12.3, Avg±SE, p = 0.03). (G–H) Lateral views of live 32 hpf embryos. (G) In an embryo injected with the tfap2a/e MO alone, or (H) in an embryo co-injected with bcl2-gfp mRNA, melanophores appeared similarly poorly differentiated. Insets in G and H, higher magnification views of melanophores in the respective embryos. Scale bars: (A–C, E–H) 100 μM; (Insets in G–H) 50 μM. |
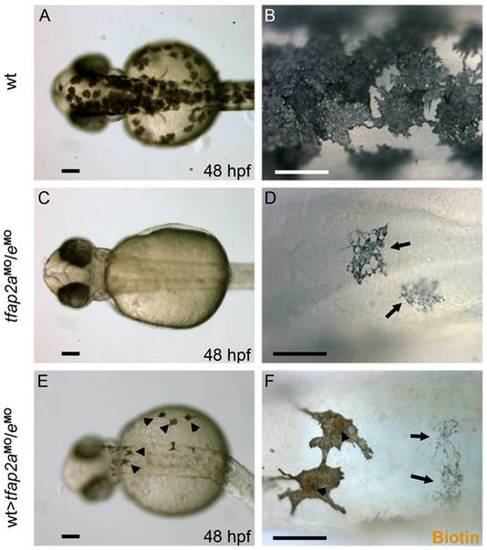
Tfap2a/e activity in melanophore differentiation appears to be cell-autonomous. (A–B) Dorsal views of a 48 hpf wild-type uninjected embryo, showing numerous, highly pigmented melanophores. (C–D) Dorsal views of a 48 hpf tfap2aMO/eMO embryo. Numbers of melanophores, and the amount of melanin per melanophore, are reduced relative to control embryos. (E–F) Dorsal views of a 48 hpf chimera generated by transplanting cells from a wild-type donor injected with biotin dextran into a tfap2aMO/eMO host, shown E) prior and F) subsequent to processing to reveal biotin. Arrowheads in E indicate normal looking melanophores. (F) Melanophores with two different morphologies are visible in this chimera. Normal-looking melanophores contain biotin (brown biotin label is most evident in the nuclei, arrowheads), indicating they are donor derived, while pale melanophores (arrows) lack biotin indicating they are host derived (In 4 embryos scored, 17 of 17 normal-looking melanophores were biotin-labeled). Scale bars: (A, C, E), 100 μm; (B, D, F), 50 μm. PHENOTYPE:
|

Melanophore differentiation in tfap2a/e doubly-deficient embryos is partially restored by forced expression of mitfa. (A–C) Lateral views of 32 hpf embryos, with anterior to the left. Insets are magnified images of the regions in white boxes. (A) A wild-type embryo injected with a control MO, exhibiting normal melanophores. (B) A wild-type embryo injected with tfap2aMO/eMO, exhibiting poorly melanized melanophores. (C) Wild-type embryo injected with tfap2aMO/eMO and co-injected with sox10:mitfa plasmid; melanophores appear closer to normal in this embryo. (D) A histogram presenting percentage of embryos from the various groups with normal melanophores; n = 68 (control MO), 91 (tfap2a/e MO), 89 (tfap2a/e MO + sox10:mitfa), totaled from 3 independent experiments. Scale bars: 50 μM. (E) Histogram presenting average cell counts (±SE) of melanophores in embryos from various groups. Notice an increase in the number of melanophores in tfap2a/e MO embryos co-injected with sox10:mitfa compared to tfap2a/e MO alone (N = 10 embryos per group, asterisks indicate a p value <0.05). (F) Histogram representing average mean gray value (±SE), calculated with ImageJ analysis of photomicrographs of melanophores in indicated groups. Injection of tfap2a/e MO causes a reduction in the mean gray value of melanophores compared to that for control MO-injected wild-type embryos. This value is increased to wild-type levels upon co-injection of sox10:mitfa into tfap2a/e MO embryos (N = 10 embryos per group, approximately 70–80 melanophores per group, asterisks indicate p values <0.05). PHENOTYPE:
|
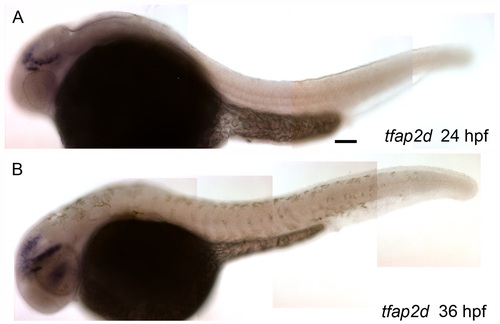
Expression of tfap2d is absent from developing melanophores. Lateral views of wild-type zebrafish embryos, fixed at the stage indicated and processed to reveal tfap2d expression by RNA in situ hybridization. (A) At 24 hpf, an embryo shows tfap2d expression within specific regions of the midbrain, (B) which persists until 36 hpf. Importantly, tfap2d expression is not detected within the trunk of these embryos. Embryos were treated with low levels of PTU to decrease melanin production to allow better visualization of potential expression within melanophores. Scale bar: 50 μM. |
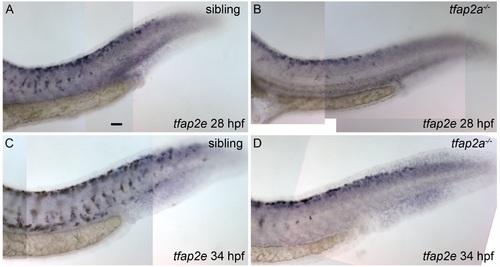
Expression of tfap2e in tfap2a mutants. Lateral views of zebrafish embryos, fixed at the stage indicated and processed to reveal tfap2e expression by RNA in situ hybridization. (A) A sibling embryo at 28 hpf with tfap2e expression within melanoblasts, located throughout the trunk of the embryo, as described earlier. (B) A tfap2a mutant, in which tfap2e expression is detected within melanoblasts near the dorsum of the embryo; it is evident that fewer than normal numbers of tfap2e-expressing cells (presumed melanoblasts) have migrated ventrally. (C) Sibling and D) tfap2a mutant embryos at 34 hpf; tfap2e expression is detected in the posterior trunk of both sibling and mutant embryos, although fewer tfap2e-expressing cells have migrated ventrally in the tfap2a mutant. Embryos were treated with low levels of PTU to better visualize expression within melanophores. Scale bar: 25 μM. |
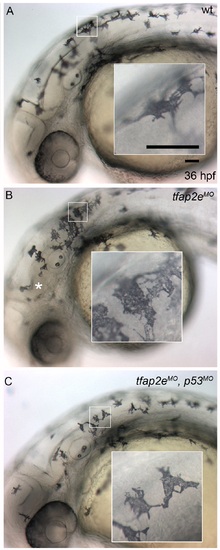
p53 MO blocks nervous system necrosis but does not affect melanophore development. Lateral views of live zebrafish embryos at 36 hpf. Insets show higher magnification of melanophores contained in white boxes. (A) A wild-type embryo shows normal melanophore development, similar to embryos injected with tfap2e e3i3 MO (B,C). (B) The embryo injected with tfap2e MO also displays signs of central nervous system cell death (i.e., patches of opacity in the brain and spinal cord, white asterisk), which is reversed (C) by co-injection of a p53 MO. |
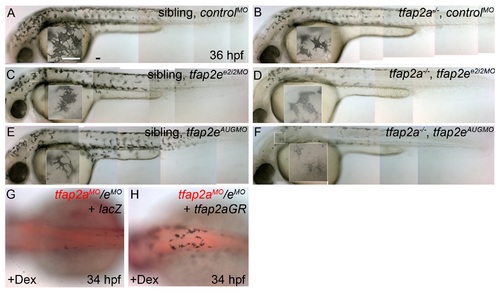
Specificity of tfap2a/e doubly-deficient melanophore defects. (A–F) Lateral views of live zebrafish embryos at 36 hpf. Insets show higher magnification of melanophores contained in the white boxes. (A–E) Sibling embryos injected with A), control MO, (C) tfap2e e2i2 MO, or (E) tfap2e AUG MO; all of these embryos exhibit normally pigmented melanophores. (B) A tfap2a mutant embryo injected with a control MO, with a reduction in melanophore numbers and melanophore migration, and slightly less than normal melanization. (D,F) tfap2a mutant embryos injected with (D) a tfap2e e2i2 MO or (F) a tfap2e AUG MO. These embryos display a further reduction in darkly pigmented melanophores, throughout the embryo. (G,H) Dorsal views of embryos at 36 hpf, anterior to the left. Embryos were first injected with tfap2a/e MO, followed by injection of mRNA encoding either (G) lacZ or (H) a dexamethasone-inducible version of tfap2a (tfap2aGR). Following injections, embryos were incubated in dexamethasone (Dex). The embryo injected with tfap2aGR shows rescue of pigmented melanophores whereas that injected with lacZ did not. Scale bars: 25 μM. |

Unillustrated author statements EXPRESSION / LABELING:
|