
Fig. 5
- ID
- ZDB-IMAGE-101013-1
- Genes
- Publication
- Van Otterloo et al., 2010 - Differentiation of zebrafish melanophores depends on transcription factors AP2 alpha and AP2 epsilon
- All Figures
- Figures for Van Otterloo et al., 2010
|
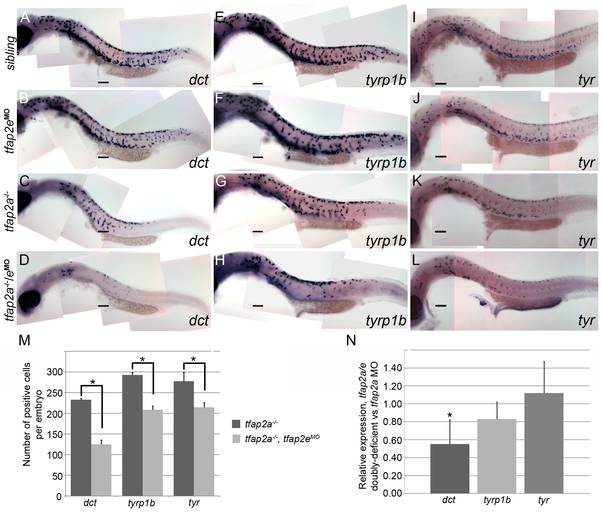
Fig. 5 tfap2a/e doubly-deficient embryos have defects in melanophore differentiation.
(A–L) Lateral views of 29 hpf embryos processed to reveal (A–D) dct, (E–H) tyrp1b, and (I–L) tyr expression. (A, E, I) Sibling embryos have greater numbers of cells expressing these markers than do (C, G, K) tfap2a mutants; (D, H, L) in tfap2a-/-/eMO embryos a further reduction is apparent. This enhanced reduction is most apparent for dct expression. (B, F, J) Sibling embryos injected with the tfap2e MO resemble uninjected sibling embryos. Scale bars: 100 μm. (M) Histogram showing average number of dct-positive, tyrp1b-positive, and tyr-positive cells in the whole embryo at 29 hpf. First pair of bars, dct-positive cells in uninjected tfap2a-/- embryos (n = 10 embryos), vs. in tfap2a-/-/eMO embryos (n = 20 embryos); second pair of bars, tyrp1b-positive cells in the uninjected tfap2a-/- embryos (n = 10 embryos) vs. in tfap2a-/-/eMO embryos (n = 20 embryos). Final pair of bars, tyr-positive cells in uninjected tfap2-/- embryos (n = 10 embryos) vs. in tfap2a-/-/eMO embryos (n = 10 embryos). Student t-test analyses indicate that the differences among cells expressing the indicated markers are statistically significant for tfap2a-deficient embryos vs. tfap2a/e-deficient embryos (for dct, p = 1.4×10⁻⁹; for tyrp1b, p = 1.5×10⁻⁸; for tyr, p = 0.02). (N) mRNA expression levels of differentiation markers in cells sorted from mitf:egfp embryos injected with the tfap2a/e MO (normalized to β-actin) relative to those in cells sorted from embryos injected with the tfap2a MO alone (normalized to β-actin) (* = p<0.05).