
Fig. 1
- ID
- ZDB-IMAGE-101012-45
- Genes
- Antibodies
- Publication
- Van Otterloo et al., 2010 - Differentiation of zebrafish melanophores depends on transcription factors AP2 alpha and AP2 epsilon
- All Figures
- Figures for Van Otterloo et al., 2010
|
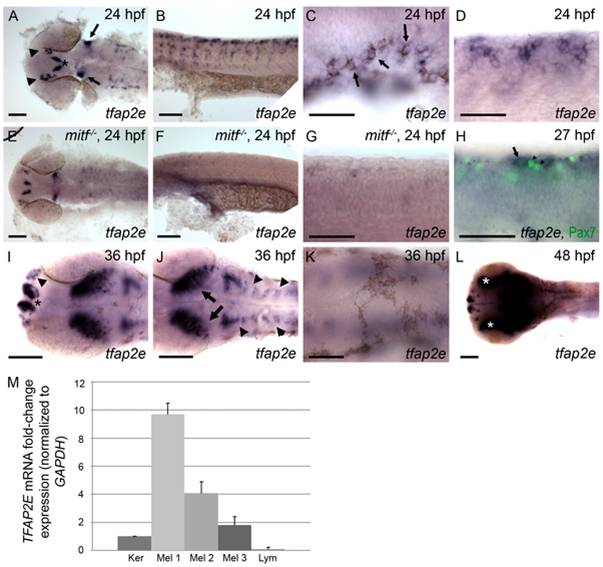
Fig. 1 Characterization of tfap2e expression during embryogenesis.
Wild-type zebrafish embryos, unless otherwise indicated, fixed at the stage indicated and processed to reveal tfap2e expression by RNA in situ hybridization. All embryos in this and subsequent figures are oriented with anterior to the left. (A) Dorsal view of the head showing tfap2e expression in presumed olfactory placode (arrowheads), medial telencephelon (asterisk), and hindbrain (arrows). (B) Lateral view of the trunk, showing tfap2e expression in cells migrating from the dorsal neural tube. (C) Lateral view just caudal to the ear. tfap2e expression is seen in newly-pigmented melanophores (arrows). (D) Higher-magnification view of the tfap2e-expressing cells of the trunk that are shown in panel B. (E–G) tfap2e expression in mitfab692 homozygous mutant embryos, in (E) dorsal and (F,G) lateral views. E) Expression of tfap2e in the head is virtually normal, (F, G) while its expression in the trunk is virtually absent. (H) Lateral view of a wild-type embryo processed to reveal tfap2e mRNA and Pax7 protein, a marker of xanthophores. tfap2e expression (arrow) does not overlap with α-Pax7 immunoreactivity (arrowheads). (I,J) Dorsal head views. I) At 36 hpf, tfap2e expression is visible in the olfactory placode (arrowheads in I), in bilateral clusters in the telencephalon (asterisk); J) in the optic tectum (arrows), and in rhombomeres (arrowheads in J). K, L) Dorsal views of the head. K) At 36 hpf expression of tfap2e in melanophores is no longer detectable. L) At 48 hpf tfap2e expression is detected in the retina (asterisks). (M) Quantitative RT-PCR shows that expression of TFAP2E in 3 independent primary human melanocytes (Mel 1–3) is about 2–10 fold higher than in keratinocytes (Ker), while its expression in Jurkat cells (lymphocytes, Lym) is about 10 fold lower than in keratinocytes. Scale bars: (A, B, E, F, H, I, K), 100 μm; (C, D, G, J), 50 μm.