
- Title
-
PDGF signaling is required for epicardial function and blood vessel formation in regenerating zebrafish hearts
- Authors
- Kim, J., Wu, Q., Zhang, Y., Wiens, K.M., Huang, Y., Rubin, N., Shimada, H., Handin, R.I., Chao, M.Y., Tuan, T.L., Starnes, V.A., and Lien, C.L.
- Source
- Full text @ Proc. Natl. Acad. Sci. USA
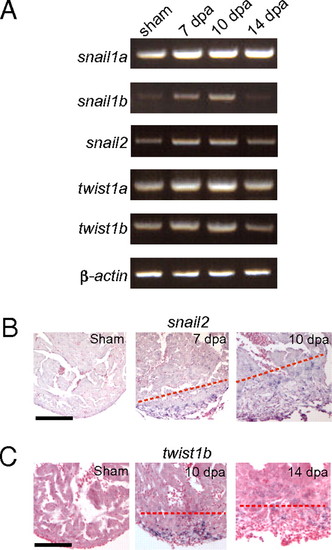
EMT markers are up-regulated during zebrafish heart regeneration in vivo. (A) RT-PCR analysis of EMT markers. Expression of snail1a, snail1b, snail2, twist1a, and twist1b was examined in sham and 7-, 10-, and 14-dpa hearts by semiquantitative RT-PCR. RT-PCR of β-actin is included as a loading control. (B) snail2 ISH in sham and 7- and 10-dpa hearts. (Scale bar = 100 μm.) (C) twist1b ISH in sham and 10- and 14-dpa hearts. The dashed line marks the approximate position of the amputation plane. (Scale bar = 100 μm.) EXPRESSION / LABELING:
|
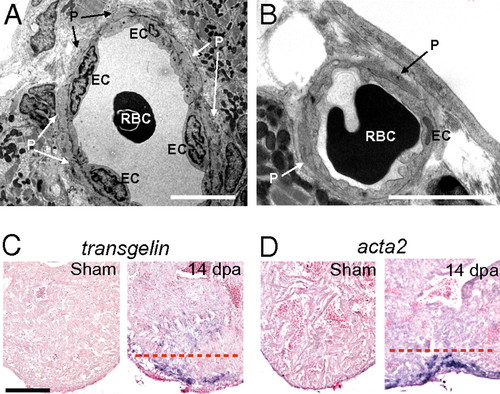
Mural cells are present in coronary vessels in the wound during zebrafish heart regeneration. (A and B) Transmission EM images of coronary vessels in the wound of 14-dpa regenerating hearts. EC, endothelial cells. P, pericytes. RBC, red blood cells. (Scale bar = 5 μm.) ISH using digoxigenin-labeled antisense probes against tagln (C) and acta2 (D) in sham-operated and 14-dpa regenerating hearts. The dashed red line marks the approximate position of the amputation plane. (Scale bar = 100 μm.) EXPRESSION / LABELING:
|
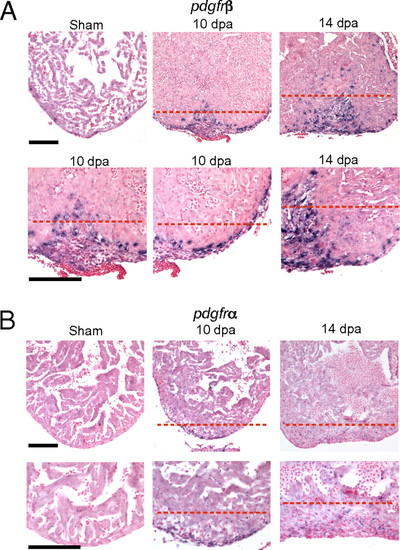
pdgfrβ is up-regulated during zebrafish heart regeneration. ISH using digoxigenin-labeled antisense probes against pdgfrβ (A) and pdgfrα (B) in sham-operated and 10- and 14-dpa regenerating hearts. The lower row of images in A and B contain enlarged images of the upper row. The enlarged images are also slightly panned to show the epicardium. The dashed red line marks the approximate position of the amputation plane. (Scale bar = 100 μm.) EXPRESSION / LABELING:
|
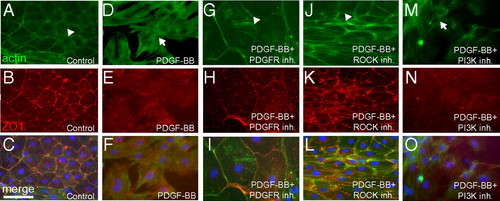
PDGF signaling is sufficient to induce stress fibers and loss of cell-cell contacts in vitro. Sham-operated hearts were cultured in the presence of 0.5% serum for 3 d and then treated with 0.5% BSA as a control (n = 12 hearts) (A–C), PDGF-BB (n = 4 hearts) (D–F), PDGF-BB and PDGFR inhibitor (Inh.; 2 μM, n = 4 hearts) (G–I), PDGF-BB and ROCK inhibitor (2 μM, n = 4 hearts) (J–L), or PDGF-BB and PI3K inhibitor (2 μM, n = 4 hearts) (M–O) for 1 d (i.e., from day 3 to day 4 in culture) (actin, green; DAPI: blue; ZO1, red). Actin localized to the subcortical region is marked by arrowheads, and stress fibers are marked by arrows. Each individual explant was imaged in at least three different fields of view, and a representative image is shown. (Scale bar = 50 μm.) |
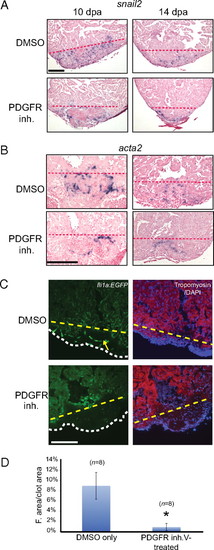
PDGF signaling is required for coronary blood vessel formation during zebrafish heart regeneration. (A) Treatment of wild-type fish with DMSO or PDGFR inhibitor (inh.) from 2–14 dpa. snail2 ISH was performed using 10- and 14-dpa hearts. (Scale bar = 100 μm.) (B) Treatment of wild-type fish with DMSO or PDGFR inhibitor from 2–14 dpa. acta2 ISH was performed using 10- and 14-dpa hearts. (Scale bar = 100 μm.) (C) Treatment of fli1a:EGFP fish with PDGFR inhibitor from 2–14 dpa. Hearts were collected and processed at 14 dpa (DAPI staining, blue; tropomyosin staining, red). An example of blood vessel formation (green) in the regenerating hearts is marked by the yellow arrow. The dashed lines mark the approximate position of the amputation plane in A–C. The white dashed line indicates the outline of the fibrin clot in the regenerating hearts. (Scale bar = 100 μm.) (D) Quantification of blood vessel formation. The total fluorescent (F.) area was measured relative to total clot area (n = 8 hearts for DMSO and PDGFR inhibitor treatment). *P < 0.0001. |

Whole-mount ISH of pdgfrβ. ISH using digoxigenin-labeled antisense probes against pdgfrβ in sham and 6-, 10-, and 14-dpa regenerating hearts. A, atrium; BA, bulbus arteriosus; V, ventricle. *Fibrin clot in the wound. (Scale bar = 200 μm.) |

Thrombocytes present at the wound site express pdgfb. (A) Thrombocytes marked by CD41-EGFP fluorescence are localized in the wound area from 3-14 dpa (CD41-GFP, green; DAPI, blue; tropomyosin, red). (Scale bar = 100 μm.) (B) Immunostaining of PDGF-B (red) in a CD41-EGFP-positive thrombocyte. The staining pattern indicated the localization of PDGF-B in α-granules of thrombocytes. (Scale bar = 2.5 μm.) EXPRESSION / LABELING:
|
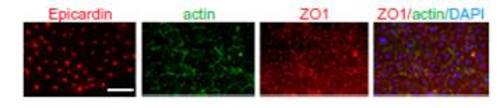
Primary epicardial cell culture in vitro from sham-operated heart explants. Explant cultures of sham-operated hearts (n = 12 hearts) were cultured for 3 d on fibrin gels and then fixed and stained (actin, green; DAPI, blue; epicardin, red; ZO1, red). Actin is localized at the subcortical region. Each individual explant was imaged in at least three different fields of view; a representative image is shown. (Scale bar = 50 μm.) |
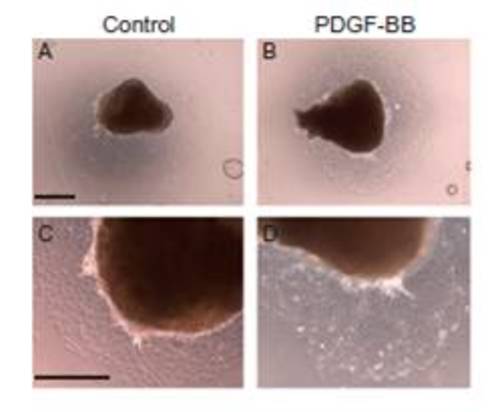
PDGF-BB induces mobile cells to detach in vitro from sham-operated heart explants. Sham-operated heart explants were cultured for 3 d and then treated with recombinant PDGF-BB (n = 6) for 1 d (from day 3 to day 4 in culture). BSA was used as a control (n = 6). Each individual explant was imaged in at least three different fields of view; a representative image is shown. (Scale bars: A and B, 500 μm; C and D, 400 μm.) |

PDGF signaling is required for DNA synthesis in 4-dpa epicardial cultures. (A) Dose-dependent effect of PDGFR inhibitor on DNA synthesis as percentage of BrdU-positive cells. Error bars indicate SEM. *P < 0.05. (B) Monolayer of epicardial cells migrated out from the apex of 4-dpa regenerating hearts after 3 d in culture. BrdU was added to the culture at the same time as DMSO (n = 12 hearts), PDGFR inhibitor (2 μM, n = 11 hearts), ROCK inhibitor (2 μM, n = 9 hearts), or PI3K inhibitor (inh; 2 μM, n = 13 hearts) for 1 d (i.e., from day 3 to day 4 in culture). BrdU staining is shown in red, and DAPI staining is shown in blue. (Scale bar = 50 μm.) (C) DNA synthesis quantified as the percentage of BrdU-positive cells. Error bars indicate SEM. *P < 0.01. |
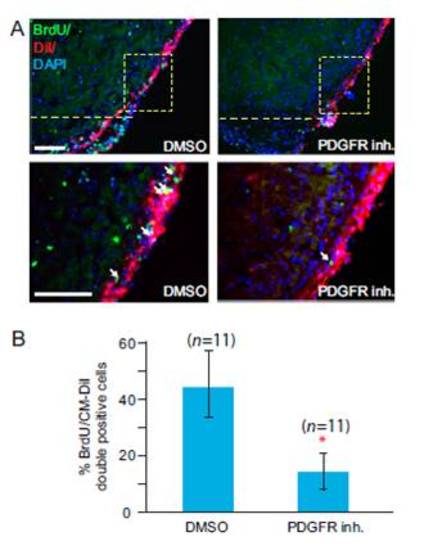
PDGF signaling is essential for proliferation of epicardial cells during heart regeneration. Treatment of regenerating hearts with DMSO as a control or with PDGFR inhibitor (inh.). The hearts were treated from 2–7 dpa and collected at 7 dpa. (A) Epicardium of zebrafish hearts was labeled with Cell Tracker CMDiI at 2 dpa (BrdU, green; CM-DiI, red). The dashed line marks the approximate position of the amputation plane. BrdU-positive epicardial cells near the wound (marked by arrows) were quantified. (Scale bars = 50 μm.) (B) Statistical analysis of in vivo BrdU incorporation in epicardial cells during heart regeneration. BrdU-positive cells in the boxed area in A were quantified. Eleven hearts (n = 11) were analyzed in each group. Error bars indicate SEM. *P < 0.01. |

PDGF signaling is required for endothelial cell formation. Treatment of fli1a:EGFP fish with PDGFR inhibitor (inh.) from 2 to 7 dpa or 10 dpa. The 7- or 10-dpa hearts were collected and processed (DAPI, blue; tropomyosin, red). Blood vessel formation is marked by fli1a:EGFP (green). The dashed lines mark the approximate position of the amputation plane. (Scale bar = 100 μm.) |