
- Title
-
Nestin Is Essential for Zebrafish Brain and Eye Development through Control of Progenitor Cell Apoptosis
- Authors
- Chen, H.L., Yuh, C.H., and Wu, K.K.
- Source
- Full text @ PLoS One
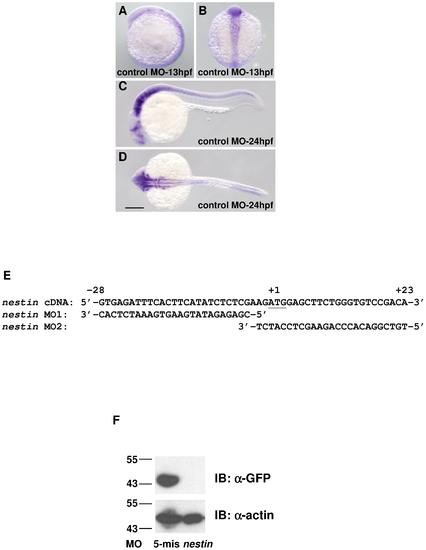
Nestin expression in zebrafish embryos. A–D. Analysis of nestin transcripts by whole-mount in situ hybridization in embryos injected with control MO. A and C, lateral view from left; B, dorsal view, head at top and D, dorsal view, head at left. Scale bar: 200 μm. E. Nucleotide sequence around the translation start site of zebrafish nestin cDNA and corresponding sequence of nestin MO1 and MO2. F. Western blot analysis of nestin:GFP fusion proteins in 30 hpf embryos treated with nestin MO (10 ng) or its 5-mis MO control (10 ng). The proteins were immunoblotted (IB) with a GFP (α-GFP) or actin antibody (α-actin). EXPRESSION / LABELING:
|
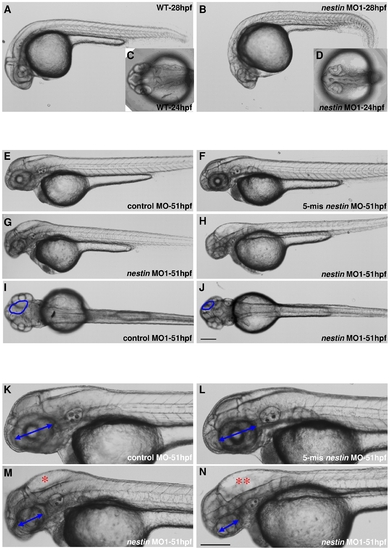
Embryo morphological changes induced by nestin MO. A–D. One-cell stage embryos were injected with 10 ng nestin MO and morphology was examined at 24 hpf and 28 hpf. Compared to normal morphology of wild-type (WT) (A: lateral view and C: dorsal view), nestin morphant exhibited head malformation (B: lateral view) with unclear boundaries between brain subdivisions, especially the hindbrain and midbrain boundary (D: dorsal view). E-J. Embryos were examined at 51 hpf after injection of 10 ng nestin MO1 or an equal amount of control MO and 5-mis nestin MO. The head abnormality had become more pronounced in nestin morphants with overt hydrocephalus (G and H). G illustrates mild and H, severe hydrocephalus. The morphology of control MO and 5-mis nestin MO remained normal (E and F). Dorsal view of nestin morphants revealed reduced size of tectum (J) compared with control morphants (I). K–N. Magnified views of E–H to illustrate the gross head and eye defects and hydrocephalus in nestin morphants. Blue circles in I and J refer to tectum. Blue double-head arrows in K–N denote diameter of the eyes. * denotes mild and ** severe hydrocephalus. The scale bar is 200 μm. |

Examination of brain tissues and eyes by H&E staining. Embryos at 48 hpf after control or nestin MO injection were sectioned at midbrain (A and B) and hindbrain (C and D) levels. Tissues were stained with H&E. Eyes at the midbrain level were visualized and shown in E and F. The scale bar is 50 μm. PHENOTYPE:
|

Effects of nestin MO injection on ascl1b (marker of NPC), Elavl3/4 (marker of mature neurons) and otx2 (marker of midbrain tissue). A. Ascl1b expression was analyzed by WMISH at 25 hpf. Upper panel shows dorsal view with deletion of yolk. Lower panel shows lateral view, head to the left. B. Elavl3/4 was analyzed by confocal microscopy at 25 hpf. C. Otx2 was analyzed by WMISH at 25 hpf. Scale bar: 200 μm. EXPRESSION / LABELING:
|
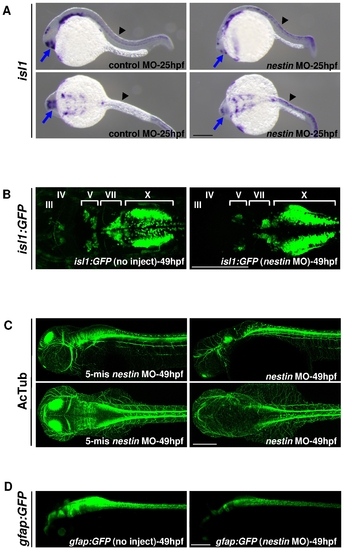
Effects of nestin MO injection on isl1, acetylated tubulin (AcTub) and gfap:GFP expression. A. Isl1 expression was analyzed by WMISH at 25 hpf. Arrow indicates for brain and arrow head, spinal cord. B. Transgenic Tg(isl1:GFP) embryos were injected with nestin MO. GFP expression was examined under confocal microscopy at 49 hfp. Uninjected WT (no inject) was used as a control. C. AcTub expression (axon marker) was examined by confocal microscopy at 49 hpf. The upper panels show lateral view and the lower panels, dorsal view. D. Heterozygous Tg(gfap:GFP) embryos were injected with nestin MO and GFP was visualized under fluorescent microscopy at 49 hpf. Scale bars: 200 μm. |

Analysis of apoptosis in live embryos with acridine orange staining. A. Examination by stereomicroscopy at 29 hpf. B. Examination by confocal microscopy at 53 hpf after injection of 10 ng of 5-mis or 10 ng of nestin MO. Arrows show positive staining. |
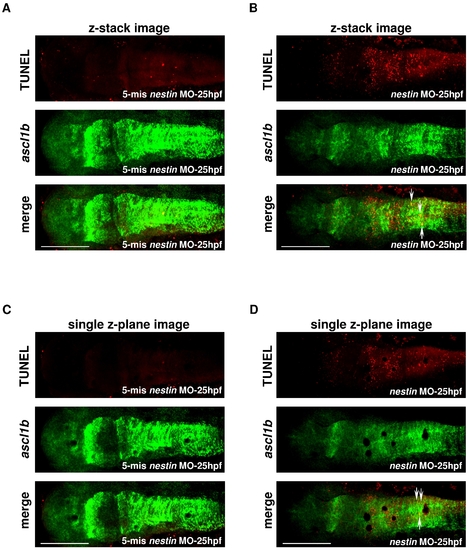
Colocalization of TUNEL signals with ascl1b expression. A and B, z-stack images and C and D, single z-plane images. Embryos were injected with (A) and (C) 5-mis nestin MO or (B) and (D) nestin MO and images were analyzed by confocal microscopy at 25 hpf. Top panels show TUNEL and middle panels, ascl1b stained by fluorescence in situ hybridization. The lower panels show merged images. Yellow dots as denoted by white arrows indicate colocalization of ascl1b with TUNEL. Bar scale: 200 μm. |
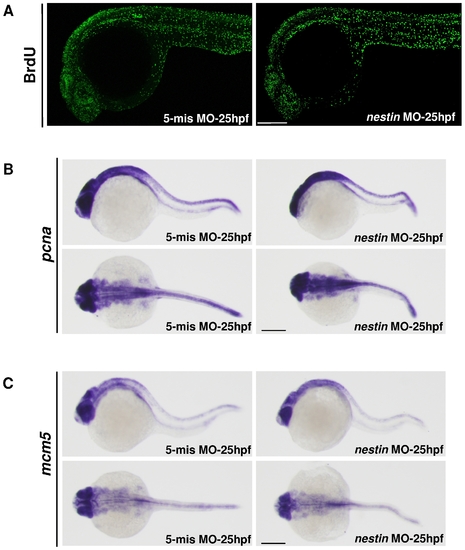
Influence of nestin MO on neural proliferation. A. Analysis of BrdU incorporation in nestin MO vs. 5-mis MO-treated embryos at 25 hpf by immunofluorescence. B and C. Analysis of (B) pcna and (C) mcm5 transcripts by WMISH. |
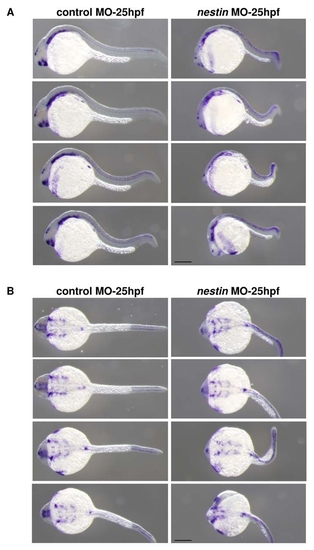
Comparison of isl1 expression in embryos treated with control MO vs. nestin MO. Isl1 expression was analyzed by WMISH. Representative figures of four embryos are shown to illustrate reproducibility of the abnormalities described in Figure 6A. A. Lateral view. B. Dorsal view. Bar scale: 200 μm. |
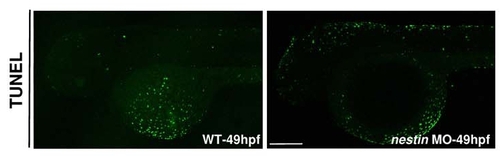
Analysis of apoptosis by TUNEL at 49 hpf. WT denotes uninjected wild-type embryo. Bar scale: 200 μm. |

Unillustrated author statements PHENOTYPE:
|