
IMAGE
Fig. S1
- ID
- ZDB-IMAGE-100304-12
- Publication
- Chen et al., 2010 - Nestin Is Essential for Zebrafish Brain and Eye Development through Control of Progenitor Cell Apoptosis
- All Figures
- Figures for Chen et al., 2010
Image
|
Figure Caption
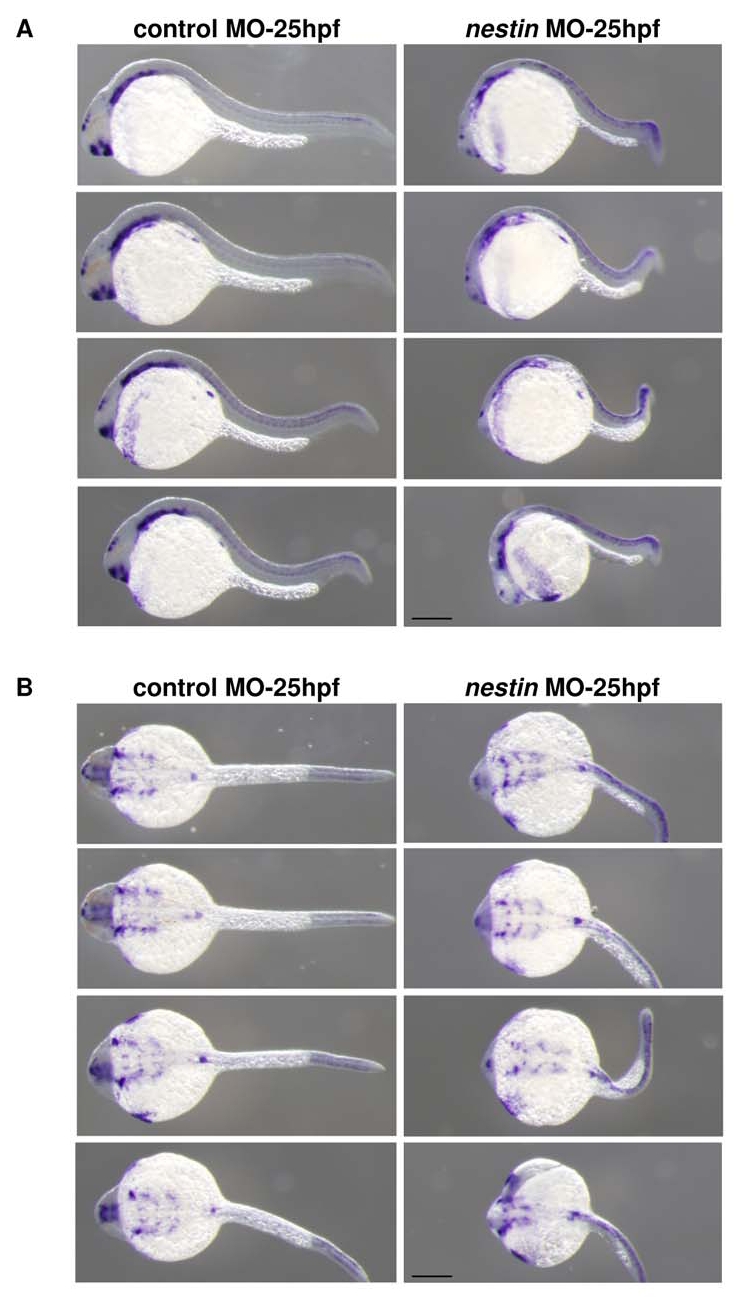
Fig. S1 Comparison of isl1 expression in embryos treated with control MO vs. nestin MO. Isl1 expression was analyzed by WMISH. Representative figures of four embryos are shown to illustrate reproducibility of the abnormalities described in Figure 6A. A. Lateral view. B. Dorsal view. Bar scale: 200 μm.
Acknowledgments
This image is the copyrighted work of the attributed author or publisher, and
ZFIN has permission only to display this image to its users.
Additional permissions should be obtained from the applicable author or publisher of the image.
Full text @ PLoS One