
Fig. 1
- ID
- ZDB-IMAGE-100304-4
- Genes
- Publication
- Chen et al., 2010 - Nestin Is Essential for Zebrafish Brain and Eye Development through Control of Progenitor Cell Apoptosis
- All Figures
- Figures for Chen et al., 2010
|
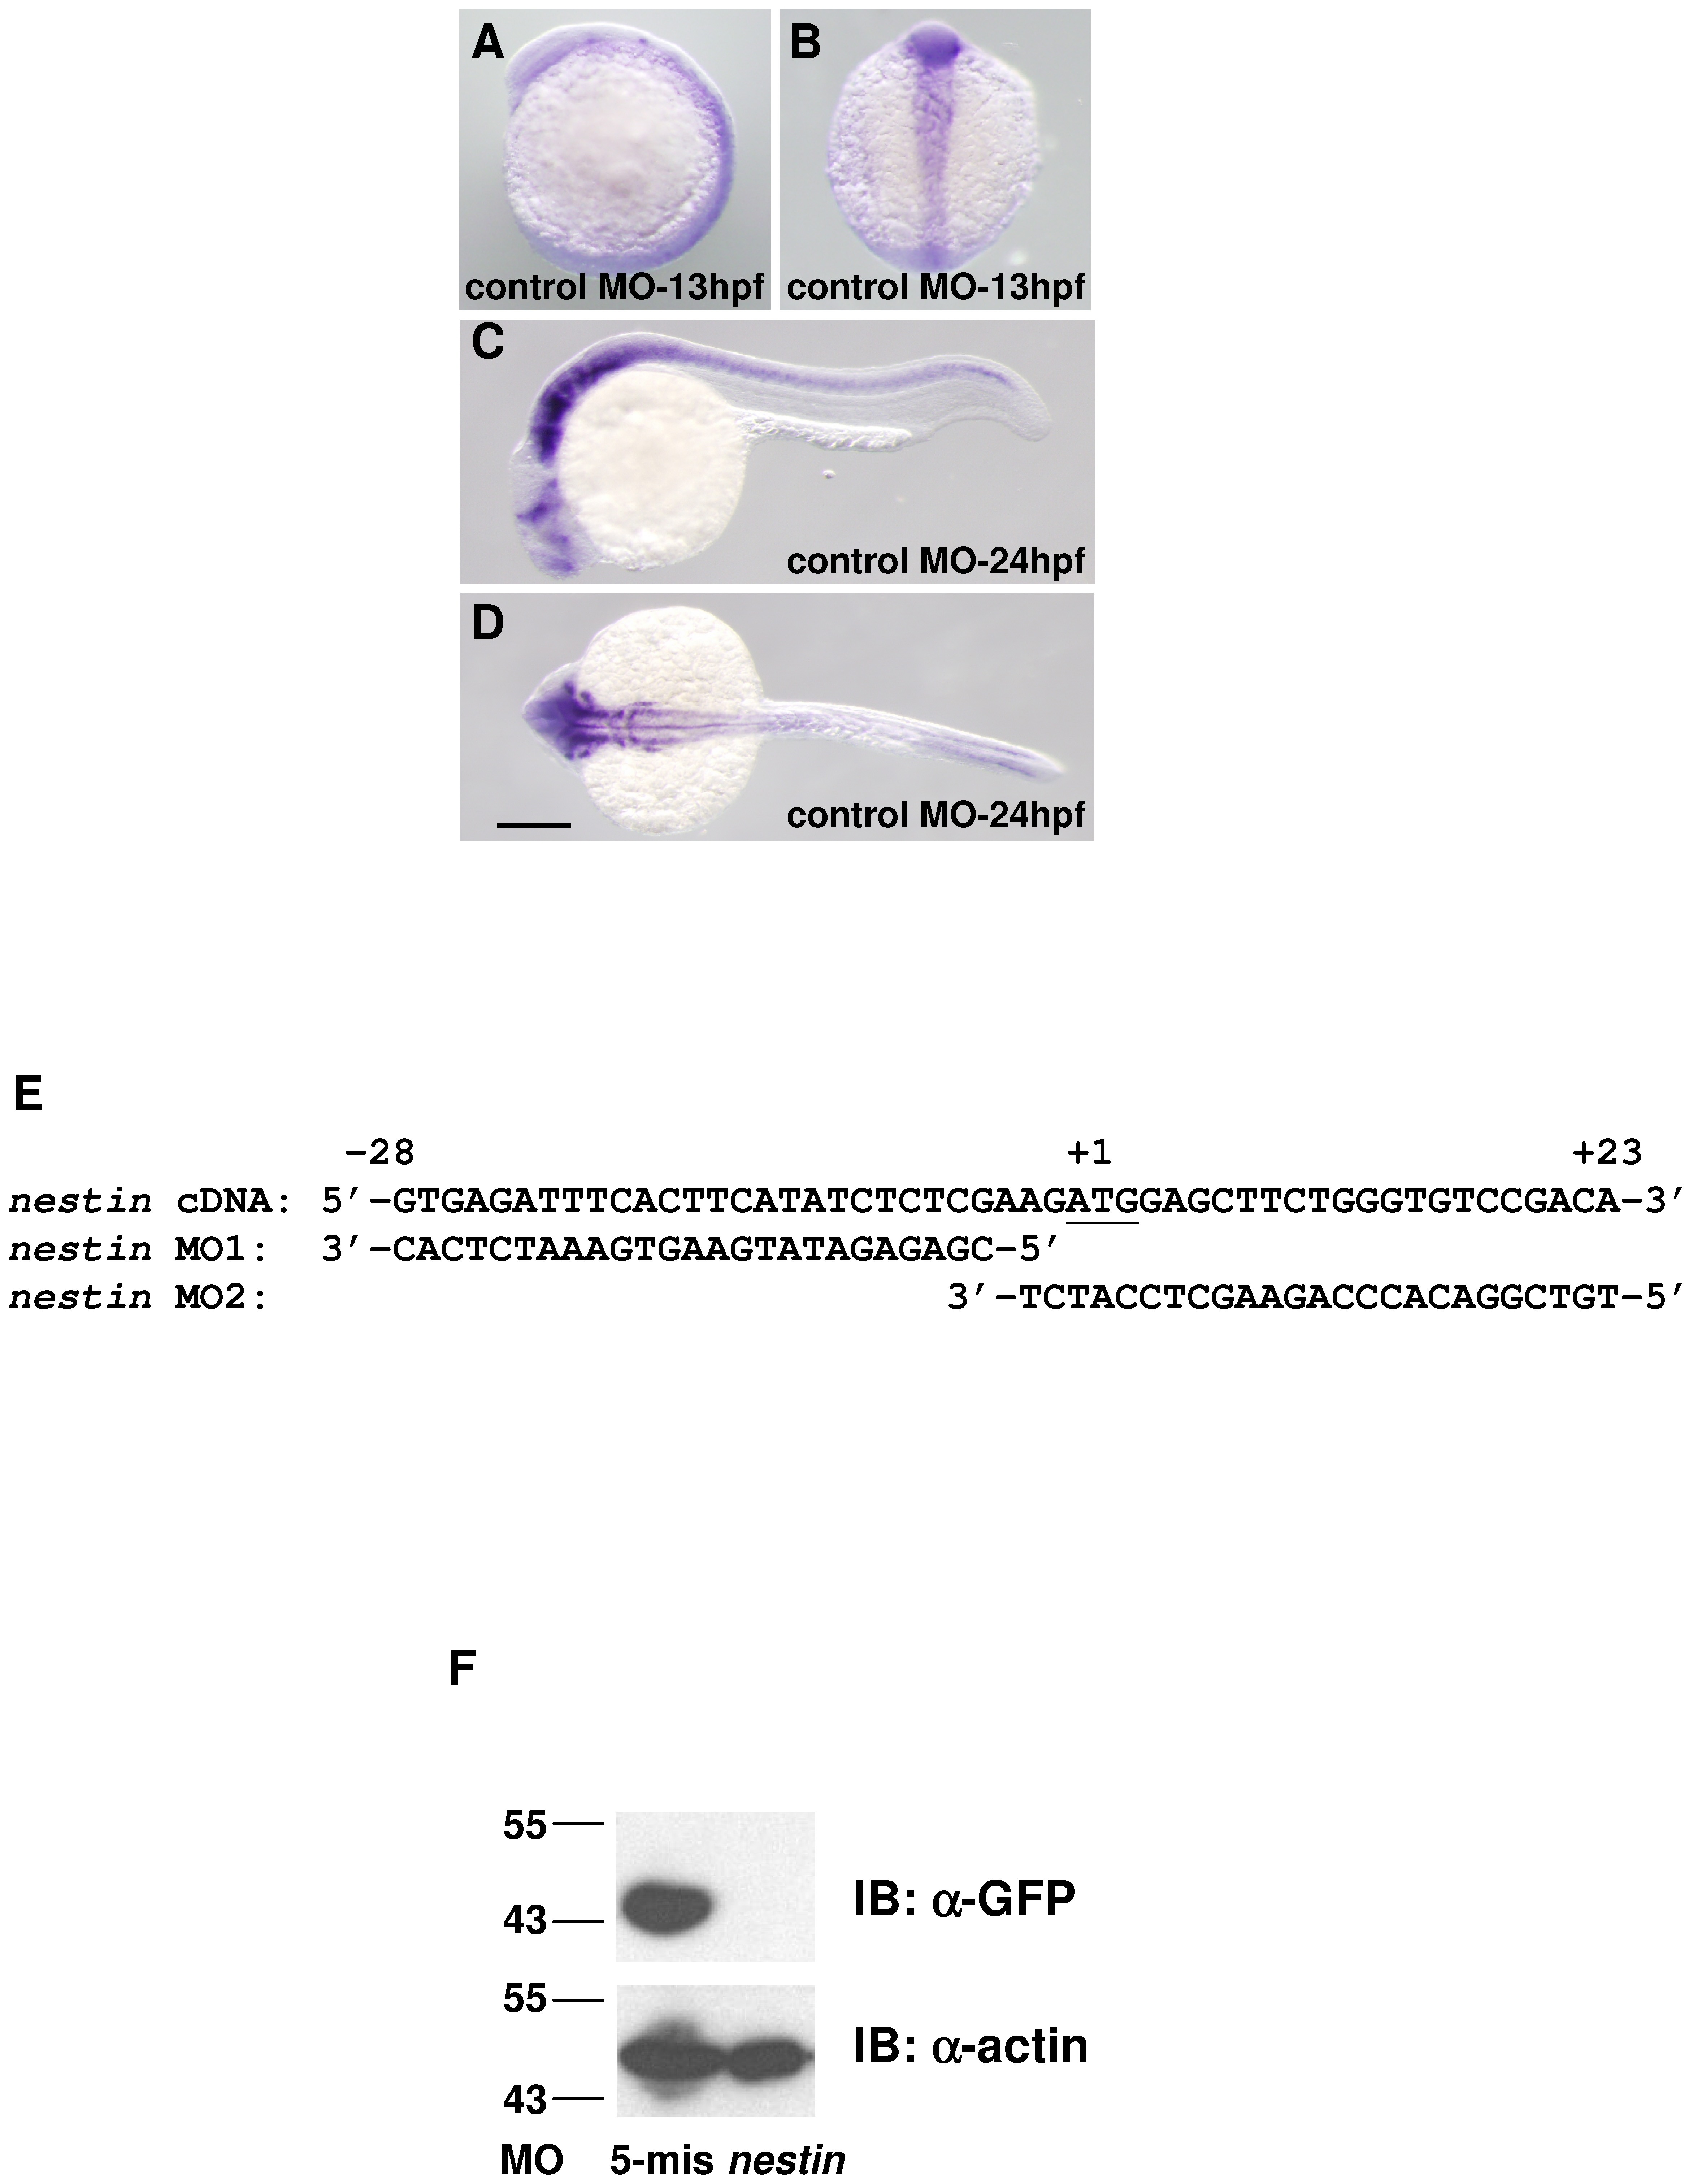
Fig. 1 Nestin expression in zebrafish embryos.
A–D. Analysis of nestin transcripts by whole-mount in situ hybridization in embryos injected with control MO. A and C, lateral view from left; B, dorsal view, head at top and D, dorsal view, head at left. Scale bar: 200 μm. E. Nucleotide sequence around the translation start site of zebrafish nestin cDNA and corresponding sequence of nestin MO1 and MO2. F. Western blot analysis of nestin:GFP fusion proteins in 30 hpf embryos treated with nestin MO (10 ng) or its 5-mis MO control (10 ng). The proteins were immunoblotted (IB) with a GFP (α-GFP) or actin antibody (α-actin).