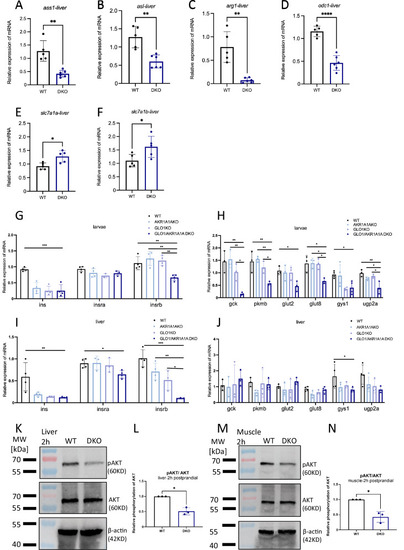
Impaired arginine and glucose metabolism in GLO1/AKR1A1A DKO zebrafish tissues.
A–F Relative mRNA expression levels of genes involved in arginine synthesis (A, B), and arginine catabolism were downregulated (C, D) and arginine transport (E, F) were upregulated in DKO liver tissues compared to WT. n = 5/6 biological replicates per group. ass1, argininosuccinate synthase 1; asl, argininosuccinate lyase; arg1, arginase 1; odc1, ornithine decarboxylase 1; slc7a1a, solute carrier family 7 member 1a; slc7a1b, solute carrier family 7 member 1b. Exact p values for each comparation are: ass1, p = 0.0059; asl, p = 0.0038; arg1, p = 0.0079; odc1, p < 0.0001; slc7a1a, p = 0.0155; slc7a1b, p = 0.0419. G, H Relative mRNA expression levels of insulin-related genes (G), and genes involved in glucose transport, glycolysis and glycogenesis (H) were significantly altered in DKO larvae. n = 3/4 biological replicates per group. ins, insulin; insra, insulin receptor a; insrb, insulin receptor b; gck, glucokinase; pkmb, pyruvate kinase M1/2b; glut2, glucose transporter 2; glut8, glucose transporter 8; gys1, glycogen synthase 1; ugp2a, UDP-glucose pyrophosphorylase 2a. I, J Relative mRNA expression levels of insulin-related genes (I), and genes involved in glucose transport, glycolysis and glycogenesis (J) were significantly altered in DKO liver tissues. n = 3/4 biological replicates per group. mRNA expression levels were quantified by RT-qPCR and normalized to arnt 2. arnt2, aryl hydrocarbon receptor nuclear translocator 2. K–N Reduced postprandial AKT phosphorylation in liver and muscle of DKO zebrafish. n = 3 biological replicates per group. Exact p values for each comparation are: L, p = 0.0189. N, p = 0.031. The bars indicate mean ± SD values. Statistical analysis were applied by a two-tailed Student’s t-test and one way ANOVA. *p < 0.05, **p < 0.01, ***p < 0.001, ****p < 0.0001. Source data are provided as a Source Data file.
|
