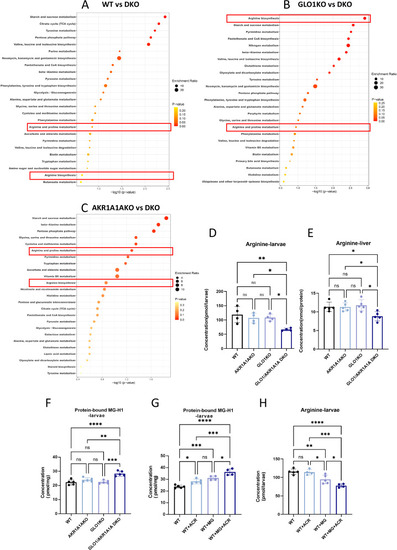
Deceased arginine levels in GLO1/AKR1A1A DKO zebrafish and larvae co-treated with MG and ACR through the formation of MG-H1.
A Enrichment analysis of the significantly altered metabolites displayed top metabolic pathways in DKO larvae compared to WT group. n = 4 biological replicates per group. B Enrichment analysis of the significantly altered metabolites displayed top metabolic pathways in DKO larvae compared to GLO1KO group. n = 4 biological replicates per group. C Enrichment analysis of the significantly altered metabolites displayed top metabolic pathways in DKO larvae compared to AKR1A1A group. n = 4 biological replicates per group. The red frame represents arginine-related pathways. Enrichment analysis was performed by MetaboAnalyst 5.0 based on KEGG database. P values were calculated using a one-sided hypergeometric over-representation test (ORA). D,E Arginine levels were the lowest in DKO larvae and liver tissues compared to WT, GLO1KO and AKR1A1AKO groups. n = 4/5 biological replicates per group. Exact p values for each comparation are: D WT vs. DKO, p = 0.0076; AKR1A1AKO vs. DKO, p = 0.0436; GLO1KO vs. DKO, p = 0.0344. E WT vs. DKO, p = 0.0318; AKR1A1AKO vs. DKO, p = 0.0345; GLO1KO vs. DKO, p = 0.0105. F Protein-bound MG-H1 levels in GLO1/AKR1A1A DKO larvae were the highest compared to WT, GLO1KO and AKR1A1AKO groups. n = 5 biological replicates per group. Exact p values for each comparation are: WT vs. DKO, p < 0.0001; AKR1A1AKO vs. DKO, p = 0.0023; GLO1KO vs. DKO, p = 0.0001. G Protein-bound MG-H1 levels were increased in WT larvae treated with ACR, MG, or both, with the highest levels observed in the co-treatment group. n = 4/5 biological replicates per group. Exact p values for each comparation are: WT vs. WT + ACR, p = 0.0151; WT vs. WT + MG, p = 0.0004; WT vs. WT + MG + ACR, p < 0.0001; WT + ACR vs. WT + MG + ACR, p = 0.0002; WT + MG vs. WT + MG + ACR, p = 0.0119. MG-H1, methylglyoxal-derived hydroimidazolone 1; ACR, acrolein; MG, methylglyoxal. H Arginine levels were significantly reduced in larvae co-treated with MG and ACR compared to those treated with either compound alone. n = 4/5 biological replicates per group. Exact p values for each comparation are: WT vs. WT + MG, p = 0.0079; WT vs. WT + MG + ACR, p < 0.0001; WT + ACR vs. WT + MG, p = 0.0186; WT + ACR vs. WT + MG + ACR, p = 0.0001; WT + MG vs. WT + MG + ACR, p = 0.0421. The bars indicate mean ± SD values. Statistical analysis was performed by one-way ANOVA. ns, not significant, *p < 0.05, **p < 0.01, ***p < 0.001, ****p < 0.0001. Source data are provided as a Source Data file.
|
