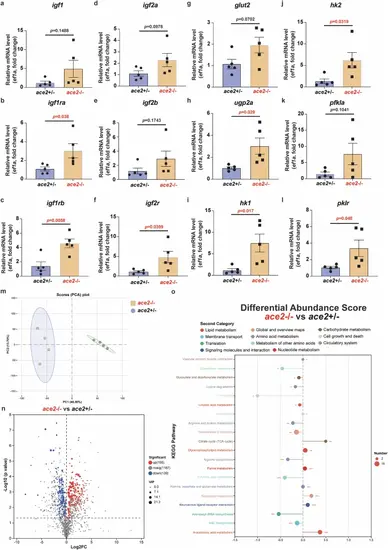
Gene expression levels of glucose metabolism pathways assessed by quantitative real‑time PCR analysis. a–f Expression of different genes of Igf signaling in zebrafish liver between the ace2 homozygous mutants and sibling heterozygous controls at 110 dpf. g Expression of glucose transporter gene glut2 in zebrafish liver between the ace2 homozygous mutants and sibling heterozygous controls at 110 dpf. h Expression of glycogen synthesis gene ugp2a in zebrafish liver between the ace2 homozygous mutants and sibling heterozygous controls at 110 dpf. i–l Expression of glycolysis gene hk1, hk2, pfkla and pklr in zebrafish liver between the ace2 homozygous mutants and sibling heterozygous controls at 110 dpf. Data shown are mean ± SEM, and statistical significance was analyzed by Student’s t-test. (*P < 0.05; **P < 0.01; n = 5/each group). m PCA (Principal component analysis) of non-targeted metabolomics within zebrafish muscle between the ace2 homozygous mutants and sibling heterozygous controls at 110 dpf (ace2+/−, n = 4; ace2−/−, n = 4). n Volcano plot of differential metabolites in zebrafish muscle between the ace2 homozygous mutants and sibling heterozygous controls at 110 dpf (ace2+/−, n = 4; ace2−/−, n = 4). Each dot represents a metabolite. The x-axis shows the log2 fold change (ace2−/− vs ace2+/−), and the y-axis indicates the -log10 (P-value). Red dots represent significantly increased metabolites in ace2−/− (log2FC > 1 and P < 0.05), blue dots indicate significantly decreased metabolites (log2FC < -1 and P < 0.05), and grey dots represent metabolites with no significant difference. o KEGG pathway-based Differential Abundance Score analysis of differential metabolites in zebrafish muscle between the ace2 homozygous mutants and sibling heterozygous controls at 110 dpf (*P < 0.05; **P < 0.01; ***P < 0.001; ace2+/−, n = 4; ace2−/−, n = 4). The plot shows the distribution of significantly altered metabolites in KEGG pathways between ace2−/− and ace2+/− muscle. The x-axis represents the differential abundance score, calculated as (number of increased metabolites/ number of decreased metabolites) divided by the square root of the total number of detected metabolites in each pathway. A higher score indicates a tendency toward upregulation in the pathway, while a lower score suggests downregulation.
|
