|
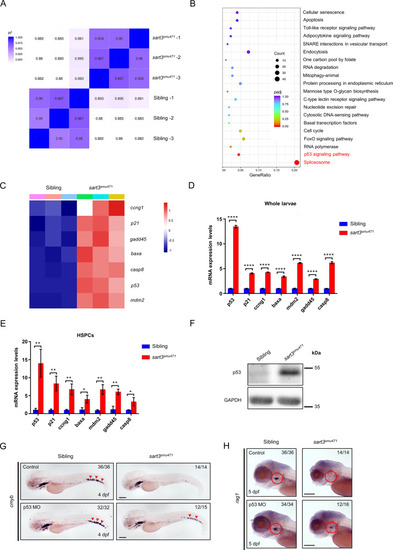
Reductions in HSPCs are p53 dependent in <italic>sart3</italic><sup><italic>smu471</italic></sup> mutants.A Distance heatmap analysis of WT siblings and sart3smu471 mutants. The color scale is shown on the left. The deeper the blue block the less different the samples are. B Spliceosome and p53 signaling pathway enrichment in sart3smu471 mutants by KEGG analysis of the RNA-seq data. C Heatmap demonstrating upregulation of p53 pathway genes in sart3smu471 mutants (data was normalized by Z-score, Z-score was shown on the right). D, E RT-qPCR validation of the RNA-seq data. Upregulation of p53 and its downstream target genes p21, ccng1, baxa, mdm2, gadd45, and casp8 in sart3smu471 whole larvae (D) and HSPCs (E) at 4 dpf (Student’s t-test, means ± SD, n ≥ 15 per group for whole larvae, n ≥ 2 × 10⁴ per group for HSPCs, ns: not significant, *P < 0.05, **P < 0.01, ****P < 0.0001). F Increased p53 protein in 4 dpf sart3smu471 mutants by western blot analysis. GAPDH was used as the loading control. G, H Phenotype restoration in p53 knockdown sart3smu471 mutants. Red arrowheads indicate WISH signals of cmyb at 4 dpf in the CHT region (G) and red circles indicate rag1 signals at 5 dpf in the thymus region (H). Scale bars: 200 µm.
|