|
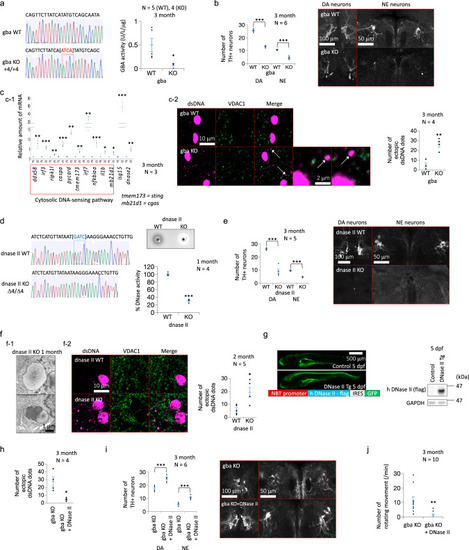
Effect of DNase II on neurodegeneration in gba KO zebrafish.a Loss of gba enzyme activity in gba KO zebrafish. WT: Wild type. KO: Knockout. U: unit. b Degeneration of tyrosine hydroxylase (TH) + neurons in gba KO zebrafish. The numbers of dopaminergic neurons (DA) in the posterior tuberculum (DC2 and DC4) and noradrenergic neurons (NE) in the locus coeruleus were significantly decreased at 3 months. WT: Wild type. KO: Knockout. c (c-1) RNA sequencing analysis in gba KO zebrafish at 3 months. WT: Wild type. KO: Knockout. c-2 Cytosolic dsDNA deposits in gba KO zebrafish at 3 months. WT: Wild type. KO: Knockout. d Loss of DNase II enzyme activity in DNase II KO zebrafish at 1 month. WT: Wild type. KO: Knockout. e Degeneration of TH + neurons in DNase II KO zebrafish. The numbers of dopaminergic neurons in the posterior tuberculum (DC2 and DC4) and noradrenergic neurons in the locus coeruleus were significantly decreased at 3 months. TH: Tyrosine hydroxylase. DA: Dopaminergic neurons. NE: noradrenergic neurons. f (f-1) Transmission electron micrographs of DNase II KO zebrafish brain. KO: Knockout. f-2 Cytosolic dsDNA deposits in DNase II KO zebrafish. WT: Wild type. KO: Knockout. g Details of NBT: human DNase II transgenic (Tg) zebrafish. NBT: Xenopus neural-specific beta-tubulin. h DNase II: Human DNase II. IRES: Internal ribosome entry site. h Cytosolic dsDNA deposits in gba KO zebrafish with or without human DNase II overexpression. KO: Knockout. i Number of tyrosine hydroxylase (TH) + neurons in gba KO zebrafish with or without human DNase II overexpression. KO: Knockout. DA: Dopaminergic neurons. NE: noradrenergic neurons. j Rotating movement in gba KO zebrafish with or without human DNase II overexpression. KO: Knockout. The statistical details are described in Supplementary Table 4. Source data of Fig. 4 are provided as a Source Data file.
|