|
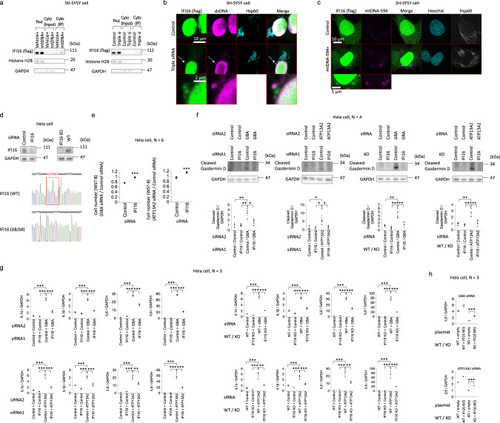
Effects of IFI16 on the cytotoxicity induced by cytosolic dsDNA of mitochondrial origin.a SH-SY5Y cells in which mitochondrial DNA was introduced (left figures) or GBA, ATP13A2, and PINK1 were depleted (right figures) were subjected to immunoprecipitation using an anti-dsDNA antibody. The immunoprecipitation results show an interaction between cytosolic dsDNA of mitochondrial origin and flag-tagged IFI16 (IFI16-flag). Nuc: Nuclear fraction. Cyto: Cytosolic fraction. Triple si: Knockdown of GBA, ATP13A2, and PINK1 expression with siRNAs. IP: Immunoprecipitation. b Colocalization of cytosolic dsDNA and IFI-16-flag in GBA-, ATP13A2-, and PINK1-depleted SH-SY5Y cells. Triple siRNA: Knockdown of GBA, ATP13A2, and PINK1 expression with siRNAs. c Colocalization of exogenous mitochondrial DNA conjugated with Alexa Fluor 594 and IFI-16-flag in SH-SY5Y cells. mtDNA-594: mitochondrial DNA conjugated with Alexa Fluor 594. d siRNA knockdown of IFI16 in HeLa cells and establishment of IFI16 knockout HeLa cells. Western blotting targeting endogenous IFI16 and the genome sequence show a homologous 8 bp deletion resulting in the complete loss of the IFI16 protein. WT: Wild type. e Effect of IFI16 depletion on cell viability (WST-8 assay) in GBA- or ATP13A2-depleted HeLa cells. f Effect of IFI16 depletion (siRNA knockdown or knockout) on cleaved Gasdermin D in HeLa cells with GBA or ATP13A2 knockdown. g Effect of IFI16 depletion (siRNA knockdown or knockout) on type I IFN responses in HeLa cells with GBA or ATP13A2 knockdown. qPCR results for IL-1α, IL-1β, IL-6, and IL-8 mRNAs are shown. h Effect of IFI16 overexpression in the cytosol (MAPKK nuclear export signal (NES)-tagged IFI16) on type I IFN responses in IFI16 knockout HeLa cells with GBA or ATP13A2 knockdown. qPCR results for IL-6 mRNAs are shown. The statistical details are described in Supplementary Table 4. Source data of Fig. 3 are provided as a Source Data file.
|