|
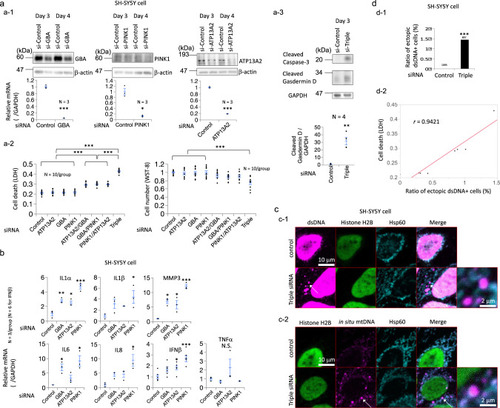
Loss of GBA, ATP13A2, and/or PINK1 leads to cytosolic leakage of mitochondrial DNA and cell death.a (a-1) Knockdown of GBA, ATP13A2, and/or PINK1 expression with siRNAs in SH-SY5Y cells. siRNA-mediated knockdown was confirmed at the mRNA and protein (western blotting) levels. a-2 The death of GBA-, ATP13A2- and/or PINK1-depleted cells was determined using the LDH assay and WST-8 assay. Triple: Knockdown of GBA, ATP13A2, and PINK1 expression with siRNAs. a-3 The death of GBA-, ATP13A2- and/or PINK1-depleted cells was determined by western blotting targeting cleaved Caspase-3 and cleaved Gasdermin D. Triple: Knockdown of GBA, ATP13A2 and PINK1 expression with siRNAs. b qPCR analysis of IL-1α, IL-1β, MMP-3, IL-6, IL-8, IFN-β and TNF-α mRNAs in GBA-, ATP13A2- or PINK1-depleted SH-SY5Y cells. N.S.: statistically not significant. c (c-1) Immunostaining for dsDNA, histone H2B and Hsp60 in SH-SY5Y cells transfected with GBA, ATP13A2, and PINK1 siRNAs. White arrows indicate cytosolic dsDNA of mitochondrial origin. Triple siRNA: Knockdown of GBA, ATP13A2, and PINK1 expression with siRNAs. c-2 In situ hybridization of mitochondrial DNA and coimmunostaining for histone H2B and Hsp60 in SH-SY5Y cells transfected with GBA, ATP13A2, and PINK1 siRNAs. White arrows indicate cytosolic dsDNA of mitochondrial origin. Triple siRNA: Knockdown of GBA, ATP13A2, and PINK1 expression with siRNAs. d (d-1) The bar graph shows the ratio of ectopic dsDNA+ cells among SH-SY5Y cells transfected with GBA, ATP13A2, and PINK1 siRNAs. Triple: Knockdown of GBA, ATP13A2, and PINK1 expression with siRNAs. d-2 The scatter plot shows the correlation between the ratio of ectopic dsDNA+ cells and cell death. The linear regression curve is shown as a red line. Cell death (LDH) values were derived from a-2 and the ectopic dsDNA + cell ratio was assessed in the same way as d-1. The statistical details are described in Supplementary Table 4. Source data of Fig. 1 are provided as a Source Data file.
|