Loss of GBA, ATP13A2, and/or PINK1 leads to cytosolic leakage of mitochondrial DNA and cell death.

a (a-1) Knockdown of GBA, ATP13A2, and/or PINK1 expression with siRNAs in SH-SY5Y cells. siRNA-mediated knockdown was confirmed at the mRNA and protein (western blotting) levels. a-2 The death of GBA-, ATP13A2- and/or PINK1-depleted cells was determined using the LDH assay and WST-8 assay. Triple: Knockdown of GBA, ATP13A2, and PINK1 expression with siRNAs. a-3 The death of GBA-, ATP13A2- and/or PINK1-depleted cells was determined by western blotting targeting cleaved Caspase-3 and cleaved Gasdermin D. Triple: Knockdown of GBA, ATP13A2 and PINK1 expression with siRNAs. b qPCR analysis of IL-1α, IL-1β, MMP-3, IL-6, IL-8, IFN-β and TNF-α mRNAs in GBA-, ATP13A2- or PINK1-depleted SH-SY5Y cells. N.S.: statistically not significant. c (c-1) Immunostaining for dsDNA, histone H2B and Hsp60 in SH-SY5Y cells transfected with GBA, ATP13A2, and PINK1 siRNAs. White arrows indicate cytosolic dsDNA of mitochondrial origin. Triple siRNA: Knockdown of GBA, ATP13A2, and PINK1 expression with siRNAs. c-2 In situ hybridization of mitochondrial DNA and coimmunostaining for histone H2B and Hsp60 in SH-SY5Y cells transfected with GBA, ATP13A2, and PINK1 siRNAs. White arrows indicate cytosolic dsDNA of mitochondrial origin. Triple siRNA: Knockdown of GBA, ATP13A2, and PINK1 expression with siRNAs. d (d-1) The bar graph shows the ratio of ectopic dsDNA+ cells among SH-SY5Y cells transfected with GBA, ATP13A2, and PINK1 siRNAs. Triple: Knockdown of GBA, ATP13A2, and PINK1 expression with siRNAs. d-2 The scatter plot shows the correlation between the ratio of ectopic dsDNA+ cells and cell death. The linear regression curve is shown as a red line. Cell death (LDH) values were derived from a-2 and the ectopic dsDNA + cell ratio was assessed in the same way as d-1. The statistical details are described in Supplementary Table 4. Source data of Fig. 1 are provided as a Source Data file.

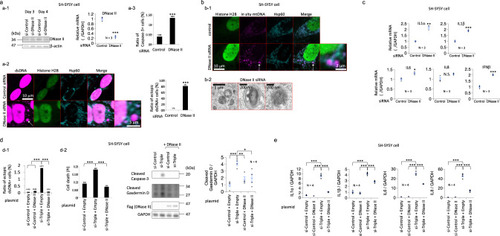
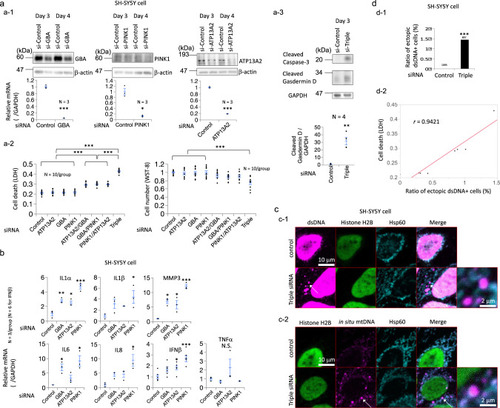
a (a-1) DNase II knockdown (6 days after transfection) in SH-SY5Y cells. siRNA-mediated knockdown was confirmed at the mRNA and protein (western blotting) levels. a-2 Immunostaining for dsDNA, histone H2B, and Hsp60 in SH-SY5Y cells transfected with the DNase II siRNA shows cytosolic dsDNA deposits (white arrow). The bar graph shows the ratio of ectopic dsDNA+ cells among SH-SY5Y cells transfected with DNase II siRNAs. a-3 The death of DNase II-depleted cells was assayed by immunofluorescence staining for caspase-3. b (b-1) In situ hybridization of mitochondrial DNA and coimmunostaining for histone H2B and Hsp60 in SH-SY5Y cells transfected with DNase II siRNA. A white arrow indicates cytosolic dsDNA of mitochondrial origin. b-2 Transmission electron micrographs of SH-SY5Y cells transfected with the DNase II siRNA. c qPCR analysis of DNase II, IL-1α, IL-1β, IL-6, IL-8, and IFN-β mRNAs in DNase II-depleted SH-SY5Y cells. N.S.: statistically not significant. d Effects of DNase II overexpression on the death of SH-SY5Y cells with GBA, ATP13A2, and PINK1 knockdown. d-1 The increase in cytosolic dsDNA deposits in GBA-, ATP13A2-, and PINK1-depleted SH-SY5Y cells were suppressed by DNase II overexpression. si-Triple: Knockdown of GBA, ATP13A2, and PINK1 expression with siRNAs. d-2 Cell death and rescue effects were assayed using western blotting for cleaved Caspase-3 and cleaved Gasdermin D and propidium iodide (PI) staining. si-Triple: Knockdown of GBA, ATP13A2, and PINK1 expression with siRNAs. e Effects of DNase II overexpression on the type I IFN responses of SH-SY5Y cells with GBA, ATP13A2, and PINK1 knockdown. si-Triple: Knockdown of GBA, ATP13A2, and PINK1 expression with siRNAs. The statistical details are described in Supplementary Table 4. Source data of Fig. 2 are provided as a Source Data file.

Effects of IFI16 on the cytotoxicity induced by cytosolic dsDNA of mitochondrial origin.

a SH-SY5Y cells in which mitochondrial DNA was introduced (left figures) or GBA, ATP13A2, and PINK1 were depleted (right figures) were subjected to immunoprecipitation using an anti-dsDNA antibody. The immunoprecipitation results show an interaction between cytosolic dsDNA of mitochondrial origin and flag-tagged IFI16 (IFI16-flag). Nuc: Nuclear fraction. Cyto: Cytosolic fraction. Triple si: Knockdown of GBA, ATP13A2, and PINK1 expression with siRNAs. IP: Immunoprecipitation. b Colocalization of cytosolic dsDNA and IFI-16-flag in GBA-, ATP13A2-, and PINK1-depleted SH-SY5Y cells. Triple siRNA: Knockdown of GBA, ATP13A2, and PINK1 expression with siRNAs. c Colocalization of exogenous mitochondrial DNA conjugated with Alexa Fluor 594 and IFI-16-flag in SH-SY5Y cells. mtDNA-594: mitochondrial DNA conjugated with Alexa Fluor 594. d siRNA knockdown of IFI16 in HeLa cells and establishment of IFI16 knockout HeLa cells. Western blotting targeting endogenous IFI16 and the genome sequence show a homologous 8 bp deletion resulting in the complete loss of the IFI16 protein. WT: Wild type. e Effect of IFI16 depletion on cell viability (WST-8 assay) in GBA- or ATP13A2-depleted HeLa cells. f Effect of IFI16 depletion (siRNA knockdown or knockout) on cleaved Gasdermin D in HeLa cells with GBA or ATP13A2 knockdown. g Effect of IFI16 depletion (siRNA knockdown or knockout) on type I IFN responses in HeLa cells with GBA or ATP13A2 knockdown. qPCR results for IL-1α, IL-1β, IL-6, and IL-8 mRNAs are shown. h Effect of IFI16 overexpression in the cytosol (MAPKK nuclear export signal (NES)-tagged IFI16) on type I IFN responses in IFI16 knockout HeLa cells with GBA or ATP13A2 knockdown. qPCR results for IL-6 mRNAs are shown. The statistical details are described in Supplementary Table 4. Source data of Fig. 3 are provided as a Source Data file.

Effect of DNase II on neurodegeneration in gba KO zebrafish.

a Loss of gba enzyme activity in gba KO zebrafish. WT: Wild type. KO: Knockout. U: unit. b Degeneration of tyrosine hydroxylase (TH) + neurons in gba KO zebrafish. The numbers of dopaminergic neurons (DA) in the posterior tuberculum (DC2 and DC4) and noradrenergic neurons (NE) in the locus coeruleus were significantly decreased at 3 months. WT: Wild type. KO: Knockout. c (c-1) RNA sequencing analysis in gba KO zebrafish at 3 months. WT: Wild type. KO: Knockout. c-2 Cytosolic dsDNA deposits in gba KO zebrafish at 3 months. WT: Wild type. KO: Knockout. d Loss of DNase II enzyme activity in DNase II KO zebrafish at 1 month. WT: Wild type. KO: Knockout. e Degeneration of TH + neurons in DNase II KO zebrafish. The numbers of dopaminergic neurons in the posterior tuberculum (DC2 and DC4) and noradrenergic neurons in the locus coeruleus were significantly decreased at 3 months. TH: Tyrosine hydroxylase. DA: Dopaminergic neurons. NE: noradrenergic neurons. f (f-1) Transmission electron micrographs of DNase II KO zebrafish brain. KO: Knockout. f-2 Cytosolic dsDNA deposits in DNase II KO zebrafish. WT: Wild type. KO: Knockout. g Details of NBT: human DNase II transgenic (Tg) zebrafish. NBT: Xenopus neural-specific beta-tubulin. h DNase II: Human DNase II. IRES: Internal ribosome entry site. h Cytosolic dsDNA deposits in gba KO zebrafish with or without human DNase II overexpression. KO: Knockout. i Number of tyrosine hydroxylase (TH) + neurons in gba KO zebrafish with or without human DNase II overexpression. KO: Knockout. DA: Dopaminergic neurons. NE: noradrenergic neurons. j Rotating movement in gba KO zebrafish with or without human DNase II overexpression. KO: Knockout. The statistical details are described in Supplementary Table 4. Source data of Fig. 4 are provided as a Source Data file.

Accumulation of cytosolic dsDNA of mitochondrial origin in the brains of humans with Parkinson’s disease.

a Effect of IFI16 depletion (siRNA knockdown) on type I IFN responses in human primary neurons following GBA knockdown. qPCR results for IL-1α, IL-1β, IL-6, IL-8, IFI16, and GBA mRNAs are shown. b Cytosolic dsDNA deposits in the brains of humans with PD (medulla oblongata). A white arrow indicates cytosolic dsDNA of mitochondrial origin. A white arrowhead indicates mtDNA within mitochondria. The graph shows the ratio of ectopic dsDNA+ number/Hoechst 33258+ cell number in the brain specimens. PD: Parkinson’s disease. c (c-1) Western blot of the IFI16 protein in brains (amygdala) of humans with PD. PD: Parkinson’s disease. c-2 Immunohistochemistry of the IFI16 protein in brains (medulla oblongata and midbrain) of humans with PD. Note that PD pathology is often observed in the amygdala and dorsal nucleus of the vagus nerve in the medulla oblongata43,44. PD: Parkinson’s disease. c-3 Immunofluorescence of the IFI16 protein in brains (medulla oblongata) of humans with PD. The white arrow indicates a Lewy body containing α-synuclein and IFI16. PD: Parkinson’s disease. α-syn: α-synuclein. d Immunofluorescence staining of human brain tissues using an anti-dsDNA antibody and anti-α-synuclein antibody. α-syn: α-synuclein. e In situ hybridization of human brain tissues (medulla oblongata) using mitochondrial DNA probes. White arrows indicate Lewy bodies or Lewy neurites containing mitochondrial DNA. α-syn: α-synuclein. f Laser microdissection of brain sections (medulla oblongata) and subsequent PCR amplification of mitochondrial or nuclear DNA sequences. The graph shows the relative amount (qPCR) of mitochondrial or nuclear DNA. “Before” shows DAB staining performed just before laser microdissection, and “After” shows staining after microdissection. Film: samples dissected from only the cover film, Out: samples dissected from areas without Lewy bodies in the brain specimens, Nuc: samples dissected from the nuclei in the brain specimens (HE staining), LB: samples dissected from the cores of Lewy bodies in the brain specimens. mtDNA: Mitochondrial DNA. n NDA: Nuclear DNA. N.S.: statistically not significant. The statistical details are described in Supplementary Table 4. Source data of Fig. 5 are provided as a Source Data file.

Acknowledgments
This image is the copyrighted work of the attributed author or publisher, and ZFIN has permission only to display this image to its users. Additional permissions should be obtained from the applicable author or publisher of the image. Full text @ Nat. Commun.