|
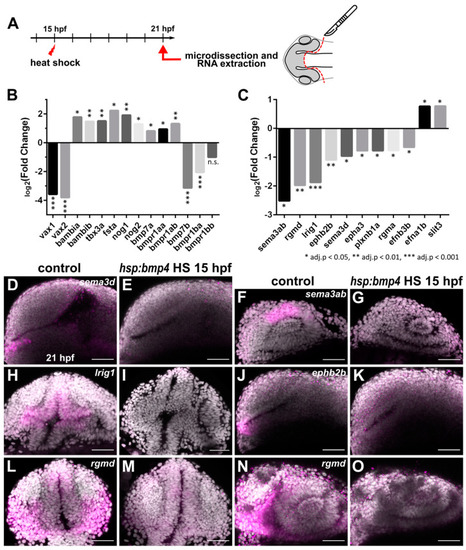
Transcriptomic analysis of forebrain tissue after bmp4 overexpression reveals differential regulation of several axon guidance factors. (A) Scheme of sample collection for transcriptome analysis. (B,C) Expression changes of selected genes related to (B) optic cup patterning and BMP signaling, and (C) axon guidance, in tg(hsp70l:bmp4) embryos induced at 15 hpf, normalized to controls, as determined by microarray at 21 hpf. Expression level change displayed as log2(Fold change). * adj. p < 0.05, ** adj. p < 0.01, *** adj. p < 0.001. (D–O) In situ hybridization of genes related to axon guidance at 21 hpf in tg(hsp70l:bmp4) embryos and controls induced at 15 hpf. (D,E) sema3d. (F,G) sema3ab. (H,I) lrig1. (J,K) ephb2b. (L–O) rgmd. (D–G,J,K,N,O) Sagittal view, nasal to the left; (H,I,L,M) transverse view. All images are maximum intensity projections; counterstaining with DAPI, scale bar 50 µm.
|