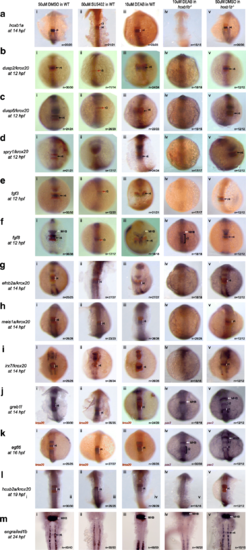
Simultaneous loss of hoxb1b and RA function disrupts expression of r4 genes. Expression of r4 genes was assayed via ISH in (i) WT embryos treated with 50uM DMSO, (ii) WT embryos treated with 50uM SU5402 (iii) WT embryos treated with 10uM DEAB, (iv) hoxb1b mutant embryos treated with 10uM DEAB and (v) hoxb1b mutant embryos treated with 10uM DMSO. The genes assayed include a hoxb1a, b dusp2, c dusp6, d spry1, e fgf3, f fgf8, g efnb2a, h meis1a, i irx7, j greb1l, k egfl6, l hoxb2a and m engrailed1b. krox20 (red), which is expressed in r3 and r5, was used to position the expression domains of several genes, as indicated. In panels (Jiv), (Jv), (Kiv) and (Kv), pax2 is the second blue marker which labels the MHB. Black arrows point to r4, red arrows to r3 and white arrows to the MHB. White and black brackets indicate r4 and r2 size, respectively. All embryos are oriented in dorsal view with anterior to the top. Embryos collected at 12hpf, 14hpf, 16hpf and 19 hpf were imaged as whole-mounts. 24hpf embryos were flat-mounted for imaging. This figure also shows that a subset of r4 genes is regulated by FGF signaling (Bii, Cii, Dii, Eii and Fii) and that r4 genes are not affected by the loss of RA signaling (embryos in row iii)
|
