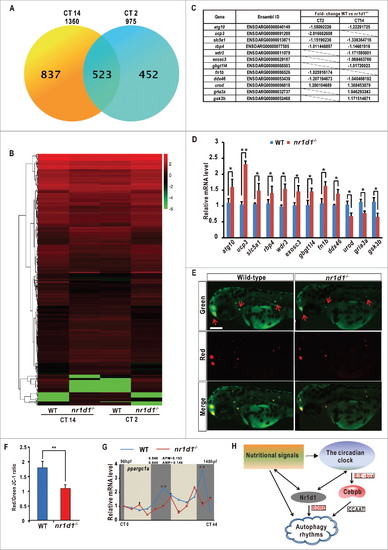
Transcriptome analysis and a model for circadian regulation of autophagy. (A) Numbers of differentially expressed genes (DEGs) in nr1d1 mutant fish at CT2 and CT12, revealed by transcriptome analysis. (B) Histogram of 523 DEGs in nr1d1 mutant fish shared between CT12 and CT2. Red colors represent upregulation, green colors downregulation. (C) List of genes with significant fold-changes, revealed by transcriptome analysis. The fold-changes were calculated by values of WT vs. nr1d1/rev-erbα. Genes with positive values were downregulated in the nr1d1 mutant, and those with negative values upregulated. (D) Upregulated genes atg10, ucp3, slc5a1, rbp4, wdr3, exosc3, gbgt1l4, fn1b and ddx46 and downregulated genes urod, gria3a and gsk3b, revealed by transcriptome analysis, are reconfirmed by independent qRT-PCR analysis. Three independent experiments were performed. Data represent mean ± s.d. (E) JC-1 staining assays. Mitochondria with low membrane potential are in green and mitochondria with high membrane potential in red. (F) Relative Red/Green ratio was quantified by ImageJ. Data represent mean±s.d. of the 3 independent experiments. **, P ≤ 0 .01. The Student t test was applied. (G) qRT-PCR analysis of ppargc1a in nr1d1 mutants under DD condition. The mRNA expression pattern was analysis by JTK-CYCLE method. ADJ.P for adjusted minimal P-values (*, P ≤ 0 .05), AMP for amplitude. Two-way ANOVA with the Tukey post hoc test was conducted (***, P ≤ 0 .001). (H) A model for circadian regulation of autophagy in zebrafish. Transcription factor cebpb is regulated by the Clock-Arntl/Bmal heterodimer and induces autophagy rhythms in zebrafish and mice, while Nr1d1 directly controls autophagy genes through RORE. Further, nutritional signals can affect both autophagy and circadian rhythms in zebrafish.
|
