FIGURE SUMMARY
Title

Inhibition of TGF-β/Smad3 Signaling Disrupts Cardiomyocyte Cell Cycle Progression and Epithelial-Mesenchymal Transition-Like Response During Ventricle Regeneration

Authors
Peng, Y., Wang, W., Fang, Y., Hu, H., Chang, N., Pang, M., Hu, Y.F., Li, X., Long, H., Xiong, J.W., Zhang, R.
Source
Full text @ Front Cell Dev Biol

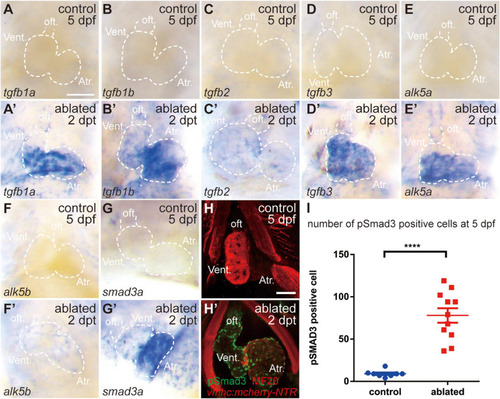
TGF-β/Smad3 signaling is activated during zebrafish ventricular regeneration. (A–G′) Whole-mount in situ hybridization showing that the expression of components of the TGF-β signaling pathway, tgfb1a, tgfb1b, tgfb2, tgfb3, alk5a, alk5b, and smad3a, was upregulated in the ablated hearts (A′–G′) compared with that in the control hearts (A–G) at 5 dpf/2 dpt. Dashed lines outline the hearts. (H–H′) Representative immunostaining images of Tg(vmhc:mCherry-NTR) hearts showing that phospho-Smad3 signal was increased in the ablated hearts (H′) than in the control hearts (H) at 5 dpf/2 dpt. Green, anti-pSmad3; red, MF20 (anti-MHC). (I) Quantification of phospho-Smad3-positive cells in the control and ablated hearts at 5 dpf/2 dpt (N = 8 and 11, respectively). Mean ± s.e.m., Student’s t-test, two-tailed, ****P < 0.0001. Scale bars, 50 μm. dpf, days post-fertilization; dpt, days post-treatment; atr., atrium; oft., out flow tract; vent., ventricle.

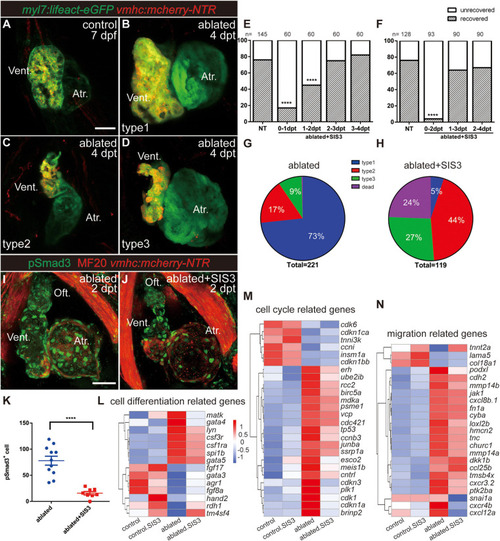
Inhibition of TGF-β/Smad3 signaling pathway impedes ventricular regeneration. (A–D) Representative fluorescence images showing the morphology of control Tg(myl7:lifeact-eGFP; vmhc:mCherry-NTR) hearts (A) and three types of ablated hearts at 7 dpf/4 dpt, fully regenerated ventricle (B, type 1), tiny ventricle (C, type 2), and partially regenerated ventricle (D, type 3). (E,F) Quantification of the heart regeneration ratio at 7 dpf/4 dpt in the ablated larvae with different length of SIS3 treatment. The numbers of larvae analyzed for each condition are indicated above the chart. Chi-square test, ****P < 0.0001. (G,H) Pie charts show cardiac morphology classification in the ablated larvae without (G) or with a 48-h SIS3 treatment (H) at 4 dpt. N = 221 and 119, respectively. (I,J) Representative immunostaining images of Tg(vmhc:mCherry-NTR) hearts showing that phospho-Smad3 signal was decreased in the ablated hearts at 5 dpf/2 dpt upon a 48-h SIS3 treatment (J). Green, anti-pSmad3; red, MF20 (anti-MHC). (K) Quantification of phospho-Smad3-positive cells in the ablated hearts without or with a 48-h SIS3 treatment at 5 dpf/2 dpt (N = 11 and 8, respectively). Mean ± s.e.m., Student’s t-test, two-tailed, ****P < 0.0001. (L–N) Transcriptomic analysis revealed differentially expressed genes involved in cell differentiation, cell cycle, and migration. Scale bars, 50 μm. dpf, days post-fertilization; dpt, days post-treatment; atr., atrium; oft., out flow tract; vent., ventricle.

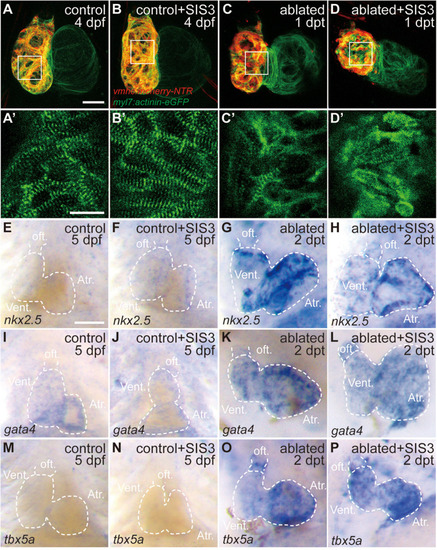
Smad3 inhibition has limited effects on sarcomere disassembly and cardiogenic factor reactivation during regeneration. (A–D′) Representative fluorescence images of Tg(vmhc:mCherry-NTR; myl7:actinin-eGFP) hearts at 4 dpf/1 dpt indicate that sarcomere disassembly occurred in the ablated hearts (C,C′) and SIS3-treated ablated hearts (D,D′). (A′–D′) Enlargement of box areas in panels (A–D), green channel only. (E–P) Whole-mount in situ hybridization showing the expression level changes of cardiogenic factors nkx2.5, gata4, and tbx5a during regeneration. Smad3 inhibition via SIS3 treatment could abolish the reactivation of nkx2.5 at 5 dpf/2 dpt (G,H) but has no effect on the reactivation of gata4 and tbx5a (K,L,O,P). Dashed lines outline the hearts. Scale bars (A–D,E–P) 50 μm and (A′–D′) 20 μm. dpf, days post-fertilization; dpt, days post-treatment; atr., atrium; oft., out flow tract; vent., ventricle.

Smad3 inhibition affects CM proliferation during regeneration. (A–D) Representative fluorescence images of Tg(vmhc:mCherry-NTR; myl7:mAG-zGeminin) larvae with immunostaining of MF20 (anti-MHC) at 5 dpf/2 dpt showing zGeminin-positive CMs in the control or ablated hearts without or with SIS3 treatment. (E) Quantification of zGeminin-positive CM number in the control or ablated hearts without or with SIS3 treatment at 5 dpf/2 dpt. N = 13, 18, 13, and 12, respectively. Mean ± s.e.m., Student’s t-test, two-tailed; ns, non-significant; ***P < 0.001, ****P < 0.0001. (F) Quantification of CM nucleus number in the ablated hearts without or with SIS3 treatment at various time points. N = 8 for each group. Mean ± s.e.m., Student’s t-test, two-tailed; ns, non-significant; ***P < 0.001, ****P < 0.0001. (G–N) Representative fluorescence images of Tg(vmhc:mCherry-NTR; myl7:H2B-EGFP) ablated hearts without or with SIS3 treatment at various time points showing the change of CM nucleus number. (O–P″) Representative fluorescent images of Tg(vmhc:mCherry-NTR) hearts with immunostaining of phospho-histone H3 (white), MF20 (red), and EdU (green) in the ablated hearts without or with SIS3 treatment at 5 dpf/2 dpt. (O,P) Maximal projections of z-stack images, overlay of three channels. (O′,P′) Optical sections of enlargement of box area in panels (O,P), overlay of red and green channels. (O″,P″) Optical sections of enlargement of dashed box area in panels (O,P), overlay of red and white channels. Arrowheads point to EdU+ CMs; arrow points to pH3+ CMs. (Q) Quantification of pH3-positive CM number in the control or ablated hearts without or with SIS3 treatment at 5 dpf/2 dpt. N = 6, 11, 10, and 10, respectively. Mean ± s.e.m., Student’s t-test, two-tailed, *P < 0.05, **P < 0.01. (R) Quantification of EdU-positive CM number in the control or ablated hearts without or with SIS3 treatment at 5 dpf/2 dpt. N = 6, 10, 9, and 11, respectively. Mean ± s.e.m., Student’s t-test, two-tailed, ***P < 0.001, ****P < 0.0001. Scale bars, 50 μm. dpf, days post-fertilization, dpt, days post-treatment; atr., atrium; oft., out flow tract; vent., ventricle; CM, cardiomyocyte.

Smad3 inhibition reduces twist expression and Snail-positive CM number during regeneration. (A–D) Whole-mount in situ hybridization showing the expression level change of the EMT marker twist1b during regeneration. Smad3 inhibition via SIS3 treatment reduced the upregulation of twist1b at 5 dpf/2 dpt. Dashed lines outline the hearts. (E–H″) Representative fluorescent images of Tg(vmhc:mCherry-NTR; flk:GFP) hearts with immunostaining of Snail (white), MF20 (red), and DAPI (blue) in the control or ablated hearts without or with SIS3 treatment at 5 dpf/2 dpt. (E–H) Maximal projections of z-stack images, overlay of red and white channels; yellow dashed lines outline the ablated area. (E′–H′) Optical sections of panels (E–H), overlay of four channels. (E″–H″) Enlargement of box area in panels (E′–H′); arrowheads point to extruding Snail+ CMs into the outer layer. (I) Quantification of Snail+ CM number in the ablated hearts without or with SIS3 treatment at 5 dpf/2 dpt. N = 6 and 8, respectively. Mean ± s.e.m., Student’s t-test, two-tailed, *P < 0.05. Scale bars, (A–D) 50 μm, (E–H′) 20 μm, and (E″–H″) 10 μm. dpf, days post-fertilization, dpt, days post-treatment; atr., atrium; oft., out flow tract; vent., ventricle; CM, cardiomyocyte; EMT, epithelial–mesenchymal transition.

Smad3 inhibition affects vimentin and N-cadherin expression during regeneration. (A–D) Whole-mount in situ hybridization showing the expression level change of vimentin during regeneration. Smad3 inhibition via SIS3 treatment reduced the upregulation of vimentin at 5 dpf/2 dpt. Dashed lines outline the hearts. (E–H″) Maximal projection images of Tg(vmhc:mCherry-NTR) hearts showing surface view of N-cadherin immunostaining (green) in the control or ablated hearts without or with SIS3 treatment at 5 dpf/2 dpt. (E′–H′) Enlargement of box area in panels (E–H). (E″–H″) Green channel only. Yellow dashed lines outline the ablated areas; open arrowheads point to N-cadherin-absent CMs adjacent to the ablated areas. (I–L″′) Optical section images of Tg(vmhc:mCherry-NTR) hearts showing the cross-section view of N-cadherin immunostaining (green) in the ventricle. (I″–L″) Enlargement of box area in panels (I–L). (I′–L′,I″′–L″′) Green channel only. Arrowheads point to regular punctate N-cadherin distribution; arrows point to irregularly dispersed N-cadherin distribution; white lines outline the outer layer without CM marker. (M) Quantification of average fluorescence intensity of N-cadherin immunostaining in the ablated hearts without or with SIS3 treatment at 5 dpf/2 dpt. N = 7 and 5, respectively. Mean ± s.e.m., Student’s t-test, two-tailed, **P < 0.01. (N) Quantification of the outer layer width of N-cadherin immunostaining in the ablated hearts without or with SIS3 treatment at 5 dpf/2 dpt. N = 7 and 5, respectively. Mean ± s.e.m., Student’s t-test, two-tailed, *P < 0.05. Scale bars, (A–D) 50 μm, (E–H) 20 μm, (E′–H″,I″–L″′) 5 μm, (I–L′) 10 μm. dpf, days post-fertilization, dpt, days post-treatment; atr., atrium; oft., out flow tract; vent., ventricle; CM, cardiomyocyte.

Acknowledgments
This image is the copyrighted work of the attributed author or publisher, and ZFIN has permission only to display this image to its users. Additional permissions should be obtained from the applicable author or publisher of the image. Full text @ Front Cell Dev Biol