FIGURE SUMMARY
Title

Expression of dlx genes in the normal and regenerating brain of adult zebrafish

Authors
Weinschutz Mendes, H., Taktek, M., Duret, T., Ekker, M.
Source
Full text @ PLoS One

<italic>dlx1a</italic>, <italic>dlx2a</italic>, <italic>dlx5a</italic> and <italic>dlx6a</italic> are expressed in the adult zebrafish brain.

Schematic representation of sections depicted in the top right panel. In situ hybridization shows dlx expression in cryosections of the adult zebrafish brain. Sagittal section showing dlx5a expression in a 6 mpf fish (A). Transverse sections showing expression throughout areas of the forebrain, midbrain and hindbrain of dlx1a (B-D), dlx2a (B’-D’), dlx5a (B”-D”) and dlx6a (B”’-D”’) in 1 ypf zebrafish (N = 6 for each dlx gene). Hc.: caudal zone of the periventricular hypothalamus; Hd.: dorsal zone of the periventricular hypothalamus; PPa.: anterior part of parvocellular preoptic nucleus; V.: ventral telencephalic area; Vd.: dorsal nucleus of V.; Vp.: parvocellular nucleus of V.; Vv.: ventral nucleus of V. Scale bar (A): 1mm; (B-D”’): 400μm.

Co-expression of <italic>dlx</italic> paralogs with markers of GABAergic neurons in adult zebrafish.

Double fluorescence ISH of transverse sections of the forebrain showing expression of dlx2a (A-B) and dlx5a (C-D) in green and expression of gad65 in red (E-H). Anatomical parts indicated. Merged images showing co-localization of dlx and gad65 in yellow [I-L] (N = 4 for dlx2a and dlx5a). Double IHC with Tg(dlx6a-1.4kbdlx5a/6a:GFP) and Calretinin or Calbindin shows co-localization, indicated by white arrows [N-P] (N = 6 for Calbindin and Calretinin). Merged images were created with ImageJ(32) software. Calret.: Calretinin and Calb.: Calbindin. Dm.: medial zone of dorsal telencephalic area; PGZ.: periventricular gray zone; PPa.: anterior part of parvocellular preoptic nucleus; PPp.: posterior part of parvocellular preoptic nucleus; V.: ventral telencephalic area; Vd.: dorsal nucleus of V.; Vp.: parvocellular nucleus of V.;Vs.: supracommissural nucleus of V.; Vv.: ventral nucleus of V. Scale bar: 400μm.

Co-localization of GFP and Sox2 in the <italic>Tg(dlx6a-1</italic>.<italic>4kbdlx5a/6a</italic>:<italic>GFP)</italic> adult zebrafish brain.

Double IHC with Tg(dlx6a-1.4kbdlx5a/6a:GFP) and Sox2 shows co-localization, indicated by white arrows, in merged images of GFP and Sox2 (C-F) (N = 8). Merged images were created with ImageJ(32) software. Hc.: caudal hypothalamus; Hd.: dorsal zone of periventricular hypothalamus; PPa.: anterior part of parvocellular preoptic nucleus; Sc.: suprachiasmatic nucleus; Vd.: dorsal nucleus of V. Scale bar: 400μm.

Immunohistochemical labeling of PCNA, GFAP and TH in <italic>Tg(dlx6a-1</italic>.<italic>4kbdlx5a/6a</italic>:<italic>GFP)</italic> adult zebrafish.

Double IHC with Tg(dlx6a-1.4kbdlx5a/6a:GFP) in combination with either PCNA, GFAP or TH. Labeling of GFP with PCNA (A-D) and GFAP (E-H), shows no co-localization of the two markers with GFP (N = 6). Labeling of GFP and TH (I-L) shows a few co-localizations of the two markers, indicated by white arrows. Merged images created with NIS-Elements Advanced Research Software. Scale bar: 200μm.

Expression of <italic>dlx1a</italic>, <italic>dlx2a</italic>, <italic>dlx5a</italic> and <italic>dlx6a</italic> post-lesion in adult zebrafish.

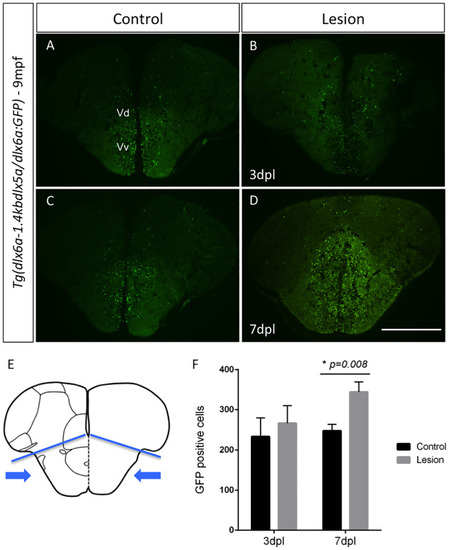
Top left panel (A) shows the location of the mechanical lesion. Expression of the four dlx paralogs in controls (C-F and G-J) and lesioned brains at 3 dpl (C’-F’) and 7 dpl (G’-J’). Down-regulation of dlx5a is suggested at 3dpl (E’ indicated by gray arrow) and confirmed by RT-qPCR (B) (Student’s t-test, n = 5, p = 0.004). A slight up-regulation of dlx2a and dlx5a is seen at 7dpl compared to controls. For each gene, and for each time point, assays were carried out with at least 2 biological replicates in 3 different experimental repetitions (N = 6). RT-qPCR analyses at 7dpl (K) reveals no significant changes in expression levels of dlx1a, dlx2a and dlx6a (N = 7 for each gene each). A significant increase in dlx5a expression was observed at 7dpl (Student’s t-test, n = 7, p = 0.008). Scale bar: 400 μM.

GFP labeling in Tg(dlx6a-1.4kbdlx5a/6a:GFP) adult zebrafish at 7 days post-lesion and cell quantification.

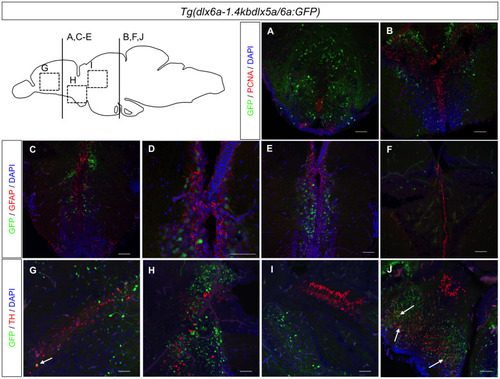
Expression of GFP in Tg(dlx6a-1.4kbdlx5a/6a:GFP) determined with a GFP antibody in controls (A and C) and regenerating brains at 3 dpl (B) and 7dpl (D). Schematic representation of the telencephalon where lesion is inflicted and areas used for cell counting of all GFP-positive cells (E) (area indicated by blue arrows bellow blue lines). Quantification of GFP+ cells in the regenerating brain at 3dpl and 7dpl (P = 0.008, N = 6) (F). Scale bar: 400 μm.

EXPRESSION / LABELING:
Gene:
Fish:
Condition:
Anatomical Term:
Stage: Adult
PHENOTYPE:
Fish:
Condition:
Observed In:
Stage: Adult

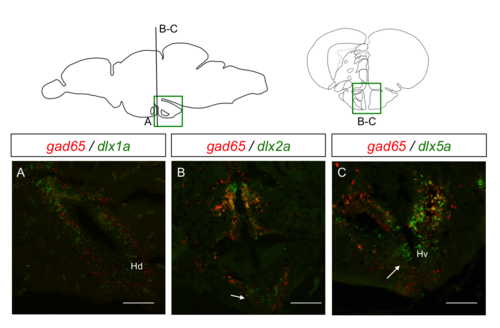
dlx1a and dlx5a expression and comparison with neurogenic areas in the adult zebrafish brain. Upper panel shows drawing of an adult brain sagittal section depicting neurogenic areas and zones with constitutive proliferation (adapted from Kizil C. et al., 2011). [A-B] shows expression of dlx1a and dlx5a verified with ISH. Arrows indicate the main areas where expression of dlx genes matches areas with constitutive proliferation. These areas are: olfactory bulb (OB), ventral nucleus of ventral telencephalic area (Vv), parvocellular preoptic nucleus, anterior part (PPa), posterial zone of dorsal telencephalic area (Dp), periventricular nucleus of posterior tuberculum (TPp) and caudal zone of periventricular hypothalamus (Hc) and dorsal zone of periventricular hypothalamus (Hd). Scale bar: 1mm.

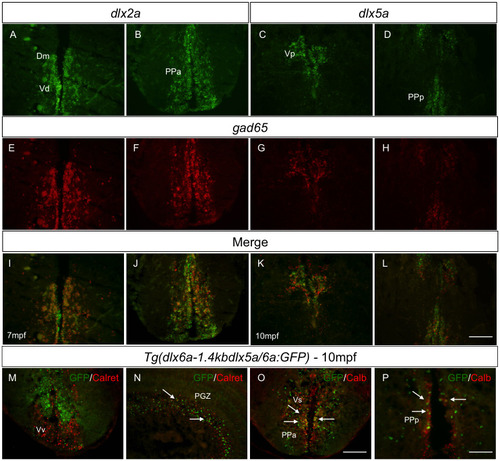
Co-expression of dlx2a and dlx5a with gad65 in the adult zebrafish forebrain. Double fluorescence in situ hybridization with transverse sections of the forebrain with (A-D) expression of dlx2a and dlx5a in green along with anatomical parts indicated and (E-H) expression of gad65 in red. (I-L) Co-localization of dlx and gad65 in yellow. Merged images were created with ImageJ(32) software. (N = 4 for dlx2a and dlx5a; N = 3 for dlx1a and dlx6a). Scale bar: 50μm.

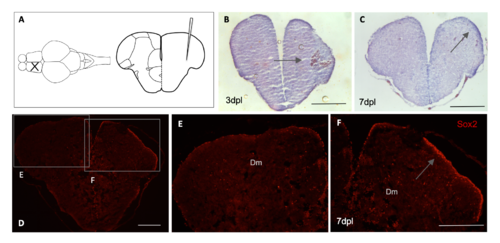
Stab lesion and tissue integrity in adult zebrafish telencephalon. Schematic representation of lesion in the telencephalon area of adult zebrafish (A). Haematoxylin-Eosin staining and arrows indicate blood clot formation at 3 dpl (n = 3) (B) and apparent increase in cell number with higher intensity of staining at the lesioned hemisphere at 7dpl (n = 4) (C). Immunohistochemical labeling with Sox2 at 7 dpl indicates higher number of neural stem cells in the ventricular zone of the telencephalon (n = 3) (D). Magnification of image shown the contralateral hemisphere in E and regenerating hemisphere in F with increase in cells positive for Sox2 in the ventricular zone of the lesioned telencephalon. Scale bar (B-F): 200μM.

Acknowledgments
This image is the copyrighted work of the attributed author or publisher, and ZFIN has permission only to display this image to its users. Additional permissions should be obtained from the applicable author or publisher of the image. Full text @ PLoS One