
- Title
-
Distinct myocardial lineages break atrial symmetry during cardiogenesis in zebrafish
- Authors
- Guerra, A., Germano, R.F., Stone, O., Arnaout, R., Guenther, S., Ahuja, S., Uribe, V., Vanhollebeke, B., Stainier, D.Y., Reischauer, S.
- Source
- Full text @ Elife

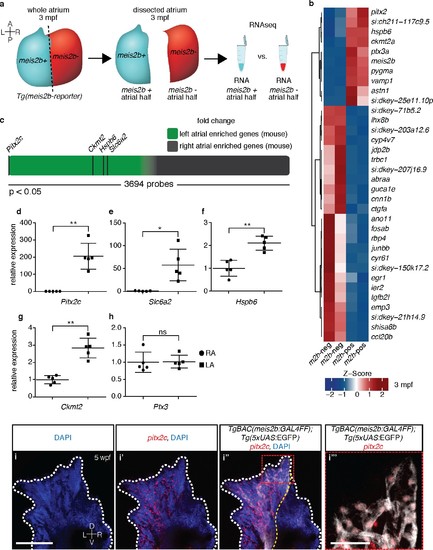
Asymmetric expression of atrial-specific transcription factor genes in adult zebrafish. (a) Comparison of different vertebrate hearts showing the emergence of distinct left and right chamber identities and atrial septation. (b) Schematic representation of the workflow for the identification of cardiac chamber-specific transcription factor gene expression. (c) Atrial gene expression level (signal intensity) and chamber-specific enrichment in the atrium (fold change >0) or ventricle (fold change <0). Red line marks 2.5 (log2) fold cutoff. Highly enriched atrial transcription factor genes (blue), ventricular (myh7l) and atrial (myh6) chamber-specific myosin genes (orange) are shown. (d) Atrial enriched transcription factor genes (log2 fold change >2.5). (e–f) Whole-mount in situ hybridization on adult zebrafish hearts; myh6 expression covers the entire atrium while meis2b expression is restricted to the left side of the atrium. (g–h) In situ hybridization on adult cardiac sections; myl7 is expressed in all cardiomyocytes while meis2b is expressed on the left side of the atrium in the wall and trabeculae (see Figure 1—figure Supplement 1a for higher magnification). (i–i’) Brightfield and fluorescence images of a 4 mpf Tg(meis2b-reporter) zebrafish atrium. (j–j’) High-magnification confocal projections of a 4 mpf Tg(meis2b-reporter) heart showing expression of the Tg(meis2b-reporter) in the myocardium (Tg(meis2b-reporter)+/MF20+/Fli cells) but not the endocardium (Tg(meis2b-reporter)-/MF20-/Fli1+cells). (e–f, i–i’) Red and white dotted lines delineate the atrium; (i’) yellow line delineates Tg(meis2b-reporter) expression. Scale bars: (e–i) 1 mm, (j’) 50 µm. EXPRESSION / LABELING:
|

Validation of the meis2b reporter line. (a) High magnification of Figure 1g showing the asymmetric expression of meis2b in the atrium of the adult zebrafish heart (red arrow, meis2b + atrial domain; black arrow, meis2b- atrial domain). (b) Schematic of the TgBAC(meis2b:GAL4FF);Tg(5xUAS:EGFP) meis2b reporter system. (c–f) Comparison of meis2b expression as detected by whole-mount in situ hybridization and Tg(meis2b-reporter) expression at 24 and 48 hpf. Note: in situ hybridization staining reaction was stopped before spinal CNS expression was fully detected in order to avoid overstaining of the head region. Scale bars: 500 µm. |
The zebrafish atrium is divided into two transcriptionally distinct domains. (a) Schematic illustrating the dissection of a Tg(meis2b-reporter) atrium into Tg(meis2b-reporter)-positive and -negative domains for RNAseq analysis. (b) Global heatmap depicting Z-score of differentially expressed genes between Tg(meis2b-reporter)-positive and -negative domains (m2b-pos and m2b-neg, respectively). Red color indicates higher expression and blue color lower expression in the respective sample listed at the bottom of each column. (c) Schematic representation of asymmetrically expressed transcripts in mouse atria as determined by microarray analysis (Kahr et al., 2011); only significantly differentially expressed genes included (3695/25697 probes). Green: significantly left atrial enriched transcripts; grey: significantly right atrial enriched transcripts. (d–h) RT-qPCR analysis of left vs. right atria in adult mouse shows that the orthologues of the most significantly enriched genes in the Tg(meis2b-reporter)-positive domain are also significantly enriched in the left atrium in mouse. Plots show relative gene expression in left atrium with respect to right atrium (n = 5). (i–i’’’) Wholemount fluorescent in situ hybridization (RNAscope) for pitx2c expression on a Tg(meis2b-reporter) zebrafish atrium [DAPI in blue, Tg(meis2b-reporter) in white, pitx2c in red]. (b–c, e) si:ch211-117c9.5 is a zebrafish orthologue of Slc6a2. (i–i’’) Red and white dotted lines delineate the atrium; (i’) yellow line delineates Tg(meis2b-reporter) expression. (d–h) Two-tailed student t-tests were performed, *p<0.05; **p<0.005; ***p<0.0005; error bars indicate ±SD. Scale bars: (i) 100 µm, (i’’’) 25 µm. EXPRESSION / LABELING:
|

Myocardial morphogenesis establishes left-right laterality from two distinct antero-posterior fields. Confocal projections of Tg(meis2b-reporter);Tg(myl7:mCherry) embryos between the 17 ss (16 hpf) and 50 hpf. (a-c) Myocardial progenitors migrate to the midline and form the cardiac disc, where Tg(meis2b-reporter) expression is confined to the posterior compartment of the cardiac disc (PDC). (d) Cardiomyocytes forming the cardiac disc appear to migrate clock-wise, rotating the forming heart tube. (e) Tg(meis2b-reporter)-expressing cells are located on the ventral side of the heart tube. (f) At 50 hpf, Tg(meis2b-reporter) expression appears on the left side of the atrium, and in a small part of the ventricle near the AV canal. (a’-f’) 3D rendered sections (as indicated in the third column, white dotted lines) of the hearts shown in a-f (see Figure 3—videos 1–6 for full reconstructions). (a’’-f’’) Schematic representation of Tg(meis2b-reporter);Tg(myl7:mCherry) expression from (a’-f’). White dotted lines delineate the heart, yellow dotted lines delineate Tg(meis2b-reporter) expression. White dotted lines in third column indicate the level of the sagittal and transverse views. First to third columns: ventral views, anterior up; (a’-e’, a’’-e’’) sagittal views, anterior up; (f’, f’’) transverse views, dorsal up. Scale bars: (a-e’) 100 µm, (f’) 50 µm. EXPRESSION / LABELING:
|

meis2b is expressed in the cardiogenic anterior lateral plate mesoderm. Whole-mount in situ hybridization for meis2b (a–f’) and myl7 (g–i) expression at several embryonic stages. Arrows point to expression of meis2b (d’–f’) and the cardiomyocyte marker myl7 (g–i) in the same region of the ALPM. (j) Confocal projection of Tg(meis2b-reporter) expression at 18 ss. (a–c) Lateral views, anterior to the left; (d–i) Dorsal views, anterior to the left; (j) red dotted line delineates the cardiac disc. Scale bars: 100 µm. |

Tg(meis2b-reporter) expression with respect to the endothelium during the cardiac disc and heart tube stages. 3D surface rendering of Tg(meis2b-reporter);Tg(kdrl:Hsa.HRAS-mCherry) embryos at 19 to 26 ss. (a) At 19 ss, endocardial cells are located ventral to the myocardium and pass through the ring of myocardial cells to connect dorsally to the aortic arches. (b) At 22 ss, endocardial cells cover most of the ventral side of the myocardium in the cardiac disc. (c) At 26 ss, Tg(meis2b-reporter) expression is observed in the ventral side of the heart tube, while endocardial cells are lining the interior of the heart tube. Left column: ventral views, anterior up. Second column: dorsal views, anterior up. Third and fourth column: transverse views, dorsal up. (d) Percentage of Tg(meis2b-reporter)-positive cardiomyocytes with respect to the total number of myl7+ cardiomyocytes from 17 to 30 ss. Scale bars: 100 µm. |
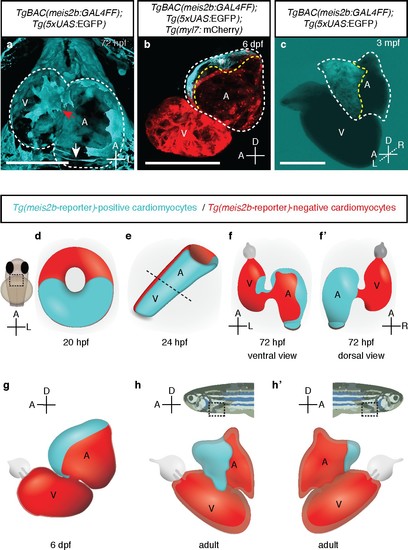
meis2b expression unveils an atrial asymmetry throughout development. (a) At 72 hpf, Tg(meis2b-reporter) expression is observed near the sinus venosus (white arrow), the dorsal and distal sides of the atrium, and a small part of the ventricle near the atrioventricular canal (red arrow) (n = 8) (Figure 4—video 1). (b) At 6 dpf Tg(meis2b-reporter) expression is found exclusively in the anterior-left compartment of the atrium at (n = 5) and in adult stages (c) in the left side of the atrium (n = 15) (Figure 4—video 2). (d-h’) Schematic of Tg(meis2b-reporter) expression throughout heart development [Tg(meis2b-reporter) expression in cardiomyocytes (cyan); meis2b-negative myocardium (red); (e) dotted line indicates the atrioventricular boundary]. (a, d–f) ventral views, anterior up; (b–c, g–h) lateral views, anterior to the left; (f’) dorsal view, anterior up; (h’) lateral view, anterior to the right. A, atrium; V, ventricle. (b–c) white dotted lines delineate the heart, yellow dotted lines delineate Tg(meis2b-reporter) expression. Scale bars: (a–b) 100 µm, (c) 500 µm. EXPRESSION / LABELING:
|

Atrial laterality is established from distinct antero-posterior fields without contribution from the second heart field. (a, c) Cardiac disc (dotted circle) at 23 ss. (b–b’) Confocal projections of photoconverted kikGR with Tg(myl7:BFP-CAAX) hearts (yellow lines) show that cells from the PDC populate the left side of the atrium while (d–d’) cells from the ADC populate the right side of the atrium (white dotted lines). (b’’, d’’) Single optical planes from b’ and d’, respectively (cardiomyocytes, green arrows; endocardial cells, white arrows). (e) Tg(meis2b-reporter) expression and antibody staining for Isl1 in the 48 hpf heart [meis2b+/Isl1+ (white arrows), meis2b+/Isl1- (green arrows) and meis2b-/Isl1+ (pink arrows) cardiomyocytes]. (f) Confocal projections of control uninjected and isl1 MO injected 48 hpf Tg(meis2b-reporter);Tg(myl7:mCherry) hearts [white lines delineate Tg(meis2b-reporter) expression]. Scale bars: 100 µm. |
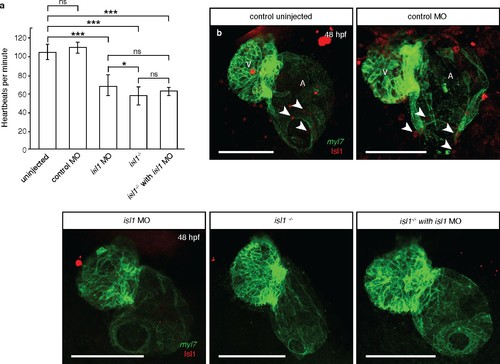
isl1 morphants have reduced levels of Isl1 protein and phenocopy isl1 mutants. (a) At 48 hpf, the heart rate of isl1 morphants (n = 10) is significantly lower than that of uninjected (n = 13) or control morpholino injected (n = 12) embryos, and similar to that of isl1 mutant embryos (n = 14), in agreement with previously published data (de Pater et al., 2009). The heart rate of isl1 mutants that were injected with isl1 morpholino (n = 3) do not show significant difference with that of isl1 mutants or morphants. (b) Antibody staining for Isl1 in 48 hpf Tg(myl7:HRAS-EGFP) hearts (arrowheads) showing decreased levels of Isl1 protein in isl1 morphants and mutants. Altogether, these data suggest that the observed cardiac phenotypes in isl1 morphants are not caused by non-specific effects from the morpholino injections. Student t-tests were performed, *p<0.05; **p<0.005; ***p<0.0005; ns, not significant; error bars indicate ±SD. Scale bars: 100 µm. |
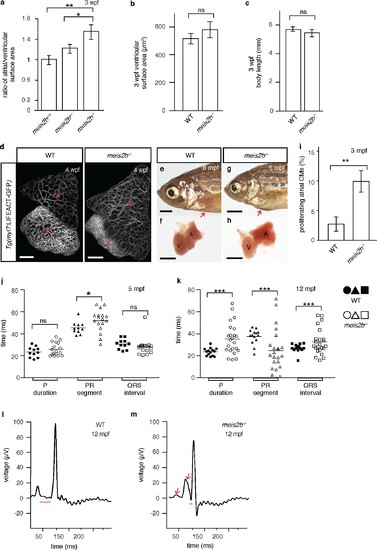
Loss of meis2b causes dysmorphic atrial growth and conduction defects. (a) meis2b-/- larvae exhibit a significant increase in the ratio of atrial to ventricular surface area, while (b) ventricular surface area and (c) body length are not affected compared to WT siblings. (d) Analysis of Tg(myl7:LIFEACT-GFP) fish reveals no obvious defects in atrial myofibrillar architecture in 4 wpf meis2b-/-. (e–h) Adult meis2b-/- display pericardial bulging (arrow) due to abnormal atrial growth. (i) meis2b-/- exhibit a significant increase in atrial cardiomyocyte (CM) proliferation at 3 mpf. (j–k) Cardiac physiology assessed using electrocardiography (ECG) at 5 and 12 mpf. (j) meis2b-/- exhibit a significant increase in PR-segment variability compared to WT siblings, while P-duration and ventricular conduction (QRS) appear unaffected at 5 mpf. (k) At 12 mpf, PR-segment, P-duration and QRS interval are significantly affected in meis2b-/-. (l–m) Representative ECGs of 12 mpf animals show reduced PR-segment duration (red line) and multiple P-waves (arrow) in meis2b-/-. Scale bars: (d) 100 µm, (e–h) 1 mm. (a–c, i) One-tailed student t-tests were performed. (j–k) F-test and Bartlett’s test were performed. Significant differences compared with control are indicated (*p<0.05; **p<0.005; ***p<0.0005); error bars indicate ± SD. A, atrium; V, ventricle; ns, not significant. EXPRESSION / LABELING:
PHENOTYPE:
|
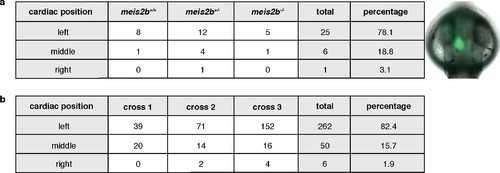
Cardiac positioning (jogging) appears unaffected in meis2b mutants. General body laterality is not affected in meis2b-/-. Cardiac jogging was assessed from the dorsal side (anterior to the top) using the Tg(myl7:LIFEACT-GFP) line, as shown in the picture on the right. (a) Cardiac jogging is not affected in meis2b-/-. (b) Assessment of cardiac jogging in three independent crosses of Tg(myl7:LIFEACT-GFP) WT fish. |

Meis2b positively regulates cardiac pitx2c expression. (a) Overview of the different samples used for microarray comparison, showing the stage, type of tissue and genotype of the compared samples. The bottom row shows the expected outcome of downstream genes potentially regulated by Meis2b. (b) Table showing the 10 genes fitting all selection criteria (for genes with n > 1, the values are averaged). Cis-regulatory MEIS1/2 DNA binding sites in orthologous mouse genes were extracted from (Penkov et al., 2013). (+, proximal binding site detected; -, no proximal binding site detected)]. (c) RT-qPCR analysis in meis2b-/- vs WT sibling atria. (d) Representation of the Pitx2 locus in mouse indicating the location of a previously reported MEIS1/2 ChIP-seq peak at the 3’ end of the regulatory region (RR) (ENSMUSR00000406450) (Penkov et al., 2013). A 53 bp conserved sequence inside the ChIP-seq peak is shown together with the MEIS1/2 binding motif. (e) ChIP-qPCR analysis on E12 embryonic mouse trunks of MEIS1/2 on the Pitx2 locus shown in (d), on the Hoxa5 locus (a known MEIS1/2 direct target), and on Myh6 locus (used as a negative control). One-tailed student t-tests (c), and one-sample t-tests (e) were performed, significant differences compared with control are indicated (*p<0.05; **p<0.005); error bars indicate ±SD. |