
Fig. 2
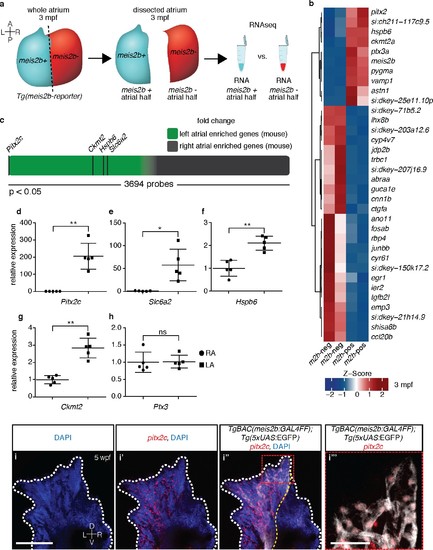
The zebrafish atrium is divided into two transcriptionally distinct domains. (a) Schematic illustrating the dissection of a Tg(meis2b-reporter) atrium into Tg(meis2b-reporter)-positive and -negative domains for RNAseq analysis. (b) Global heatmap depicting Z-score of differentially expressed genes between Tg(meis2b-reporter)-positive and -negative domains (m2b-pos and m2b-neg, respectively). Red color indicates higher expression and blue color lower expression in the respective sample listed at the bottom of each column. (c) Schematic representation of asymmetrically expressed transcripts in mouse atria as determined by microarray analysis (Kahr et al., 2011); only significantly differentially expressed genes included (3695/25697 probes). Green: significantly left atrial enriched transcripts; grey: significantly right atrial enriched transcripts. (d–h) RT-qPCR analysis of left vs. right atria in adult mouse shows that the orthologues of the most significantly enriched genes in the Tg(meis2b-reporter)-positive domain are also significantly enriched in the left atrium in mouse. Plots show relative gene expression in left atrium with respect to right atrium (n = 5). (i–i’’’) Wholemount fluorescent in situ hybridization (RNAscope) for pitx2c expression on a Tg(meis2b-reporter) zebrafish atrium [DAPI in blue, Tg(meis2b-reporter) in white, pitx2c in red]. (b–c, e) si:ch211-117c9.5 is a zebrafish orthologue of Slc6a2. (i–i’’) Red and white dotted lines delineate the atrium; (i’) yellow line delineates Tg(meis2b-reporter) expression. (d–h) Two-tailed student t-tests were performed, *p<0.05; **p<0.005; ***p<0.0005; error bars indicate ±SD. Scale bars: (i) 100 µm, (i’’’) 25 µm. |
| Genes: | |
|---|---|
| Fish: | |
| Anatomical Term: | |
| Stage Range: | Days 14-20 to Adult |