
- Title
-
Knockdown of epigenetic transcriptional co-regulator Brd2a disrupts apoptosis and proper formation of hindbrain and midbrain-hindbrain boundary (MHB) region in zebrafish
- Authors
- Murphy, T., Melville, H., Fradkin, E., Bistany, G., Branigan, G., Olsen, K., Comstock, C.R., Hanby, H., Garbade, E., DiBenedetto, A.J.
- Source
- Full text @ Mech. Dev.
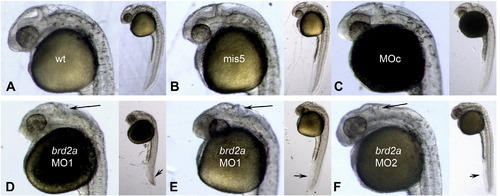
brd2aMO morphants exhibit reduced brain, ill-defined MHB, and trunk defects. Representative embryos from morpholino injection studies conducted on a total of at least three clutches and 40–60 embryos per treatment. A) uninjected, B) 4 ng MO1 five-base-mismatch-injected, C) 4 ng standard control MOc-injected, D) and E) 4 ng brdMO-injected, and F) 4 ng brd2aMO2-injected embryos, are compared at prim 5–6 stages. MO1 and MO2 target non-overlapping regions in brd2a mRNA. Control embryos appear equivalent to wildtype, while both MO1 and MO2 morphants show the same characteristic reduced brain and ill-defined midbrain-hindbrain boundary (MHB) (arrows in D,E,F). PHENOTYPE:
|
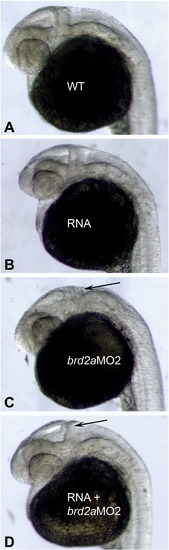
Morphological defects of brd2aMO morphants are substantially rescued by co-injection of human Brd2 mRNA. Morpholino injections were conducted with and without co-injection of in vitro transcribed human Brd2 RNA using a total of at least three clutches and 40 embryos per treatment. Lateral views of the head region of representative prim 5 stage embryos show brain structure in A) uninjected wildtype, B) embryo injected with 250 pg in vitro synthesized human Brd2 mRNA, C) embryo injected with 4 ng brd2aMO2, and D) embryo co-injected with 4 ng brd2aMO2 and 250 pg human Brd2 mRNA. Co-injection with Brd2 mRNA reduces the severity of brain and trunk defects, often restoring the size and structure of the MHB region in a good fraction of brd2aMO2 morphant embryos (D, arrow). PHENOTYPE:
|
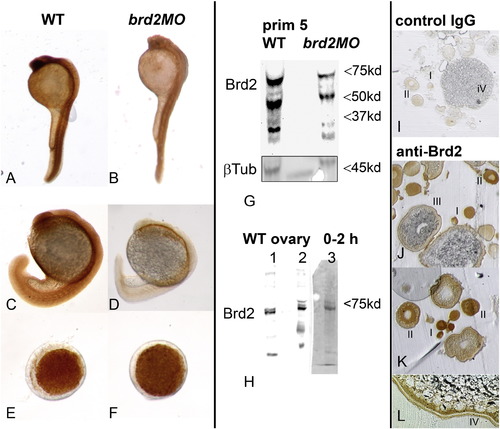
Brd2a protein is reduced in segmentation stage morphants, while maternal protein may persist in early embryos. Levels of Brd2a protein were assessed in uninjected (WT) and 8 ng brd2aMO1-injected (brd2aMO) embryos by immunohistochemistry (A–F wholemounts; I–L sections) and western blot (G, H) using the peptide antibody raised against zebrafish Brd2a. Morphant embryos at prim 5 (A,B) and 18 hpf (B,D) show reduced levels of Brd2a compared to wildtype uninjected embryos (A,C), while early embryos at 4 hpf show equivalent levels (E, F; animal pole view). Western blot shows a major protein band near 75 kD for Brd2a in prim 5 embryos (G), ovaries (H; lane 1, whole ovary; lane 2, stage I-II oocytes), and 0–2 hpf embryos (H; lane 3). Minor bands > 80 kD are often present in ovaries and early embryos, and sometimes prim 5. Putative Brd2a degradation products (or isoforms) near 55 and 37 kD are present in most preparations of prim 5 embryos (G). Reduced levels of Brd2a in brd2aMO1 prim 5 embryos are seen compared to wildtype uninjected controls (G: WT vs. brd2aMO), consistent with immunohistochemical data. Blot was reprobed for β-tubulin as loading control. Brd2a protein is detected in both unfertilized oocytes and 0–2 hpf stage embryos (H; sectioned tissue in J–L), and becomes localized to the cortical periphery of stage III-IV oocytes, tracking with its cognate mRNA (J–L). Negative control IgG in place of anti-Brd2a shows only background staining in tissue sections (I). EXPRESSION / LABELING:
PHENOTYPE:
|
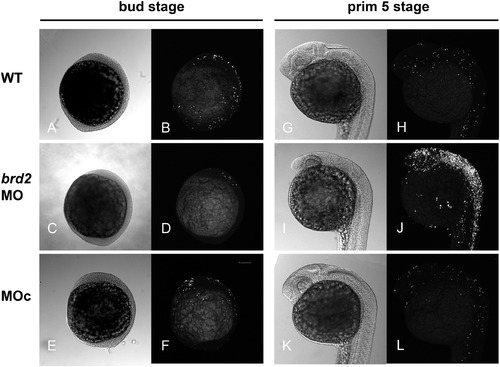
Brd2a knockdown has opposite effects on cell death at start and end of segmentation. Embryos were analyzed for apoptotic nuclei using TUNEL followed by laser-scanning confocal microscopy and quantified using SimplePCI computer analysis software. A total of 24 embryos and three clutches per treatment (uninjected WT, 8 ng brd2aMO1-injected, and 8 ng control MOc-injected) were assessed. Light micrographs with accompanying dark field maximum projection composite images show representative wildtype (A,B), brd2aMO1-injected (C,D), and control MOc-injected (E,F) embryos at bud stage; and wildtype (G,H), brd2aMO1-injected (I,J), and control MOc-injected (K,L) embryos at prim 5 stage. Cell death appears relatively reduced in morphants at bud stage (D vs. B and F), but increases dramatically compared to controls at prim 5 (J vs. H and L). |
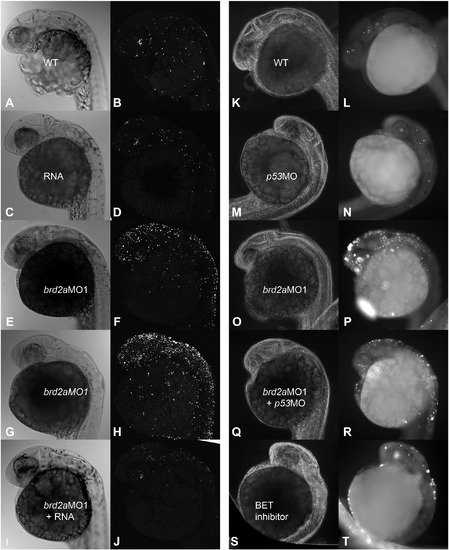
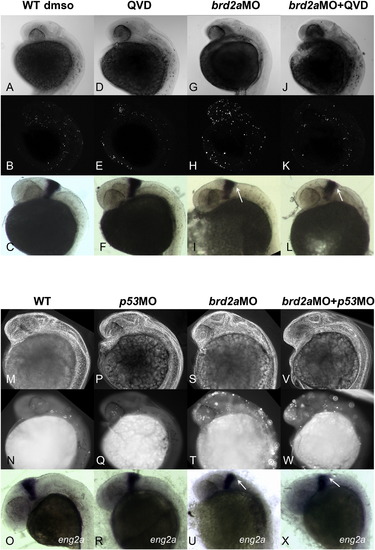
The cell death phenotype of brd2aMO morphants is rescued by co-injection of human Brd2 RNA, and is recapitulated by treatment with Brd2 BET inhibitor. Co-injection studies were conducted with 4 ng brd2aMO1and 250 pg in vitro transcribed human Brd2 RNA (A–J) or 2 ng brd2aMO1 and 4 ng p53MO (K–R) using a total of at least three clutches and 40–60 embryos per treatment. Embryos at prim 5–6 were assayed for cell death using TUNEL and analyzed with either laser scanning confocal (A–J) or conventional fluorescence (K-R) microscopy. Embryos challenged with 1 μM Brd2-specific BET inhibitor (BIC1) starting at 3 hpf are also shown (S,T). Light and dark field images of representative embryos from RNA rescue studies are shown for uninjected wildype (A,B), RNA-injected (C,D), brd2aMO1-injected (mild E,F and moderate G,H), and brd2aMO1 + RNA co-injected (I,J) groups. Representative embryos from p53MO rescue studies are shown for uninjected wildtype (K,L), p53MO-injected (M,N), brd2aMO1-injected (O,P), and brd2aMO1 + p53MO co-injected (Q,R) groups. For Brd2 BET inhibition, a total of 30 embryos and three clutches per treatment were used. Representative embryo at prim 5 after 1 μM BIC1 inhibitor treatment from 3 hpf is shown in S,T. Co-injection with human Brd2 mRNA improves brain morphology significantly and reduces cell death in morphants to levels close to normal (A–D and I, J vs. E–H). In contrast, co-injection with a 4:2 ng ratio of p53MO:brd2aMO1 shows only slight improvement in brain morphology and in levels of cell death (O,P vs. Q,R and E–H vs. I,J). Brd2 inhibitor BIC1 treatment phenocopies brd2aMO cell death, independent of morpholino use. Refer to Fig. 8A,B,C for quantitative analysis. PHENOTYPE:
|
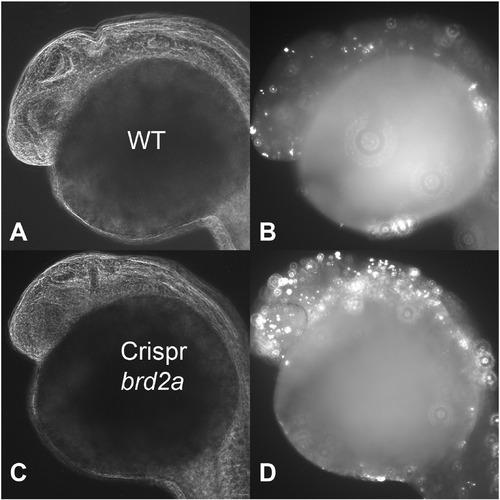
brd2a Crispr/Cas9 injections corroborate brd2aMO morphological and cell death defects. One cell stage embryos were co-injected with brd2a crRNA/tracrRNA and Cas9 mRNA, assayed by TUNEL for apoptotic nuclei at prim 5 stage, and examined by laser scanning confocal microscopy. At least 10–15 embryos from two clutches were examined. Light and darkfield images of wildtype uninjected (A,B) and brd2a Crispr/Cas9 injected (C,D) representative embryos are shown. Levels of cell death are significantly increased in brd2a Crispr/Cas9 treated samples. Refer to D for quantitative analysis. PHENOTYPE:
|
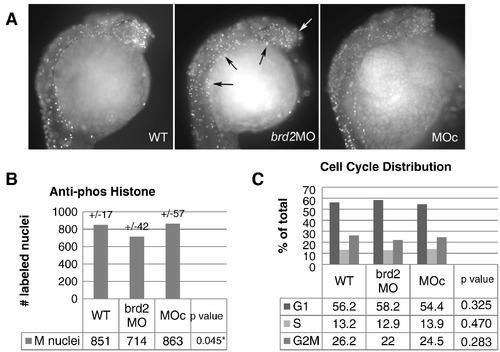
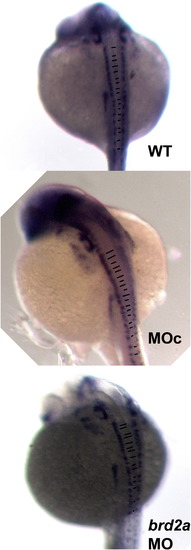
brd2aMO morphants exhibit levels of mitosis similar to controls. A) Anti-phosphohistone labeling of mitotic nuclei in prim 5 embryos. A total of 32 embryos from three clutches were used per treatment (WT, 8 ng brd2aMO1-injected, and 8 ng MOc-injected), and prim 5 stage embryos were analyzed using anti-phosphohistone H3 (anti-pH 3) antibodies followed by fluorescence microscopy. Dark field images of embryos exhibit no striking visual differences in overall levels of mitosis by treatment, but brd2aMO embryos often show ectopic mitoses at the embryo/yolk border (black arrows) and lack of mitoses in anterior telencephalon (white arrow). For quantitation in B), anti-pH 3-labeled nuclei in six optical fields for each of five embryos per treatment were counted manually using ImagePro Plus software. Mean total mitotic nuclei +/− SE for each treatment group are shown. Nested ANOVA reveals a small but significant difference (p = 0.045) among treatment groups, due mainly to brd2aMO vs MOc differences (Tukey's HSD). brd2aMO1 vs. WT differences tested below significance (p = 0.12). In contrast, WT vs. MOc differences were minimal (p = 0.98). C) Cell cycle phase distribution analysis of dissociated embryonic cells by flow cytometry. Clutches were divided into three treatment groups (WT uninjected, 8 ng brd2aMO1-injected, and 8 ng control MOc-injected), for a total of five clutches and 75–100 prim 5 embryos per treatment. Mean percentages of five trials are shown. No significant differences in phase distribution were found between treatments (one-way ANOVA and Tukey's HSD). |
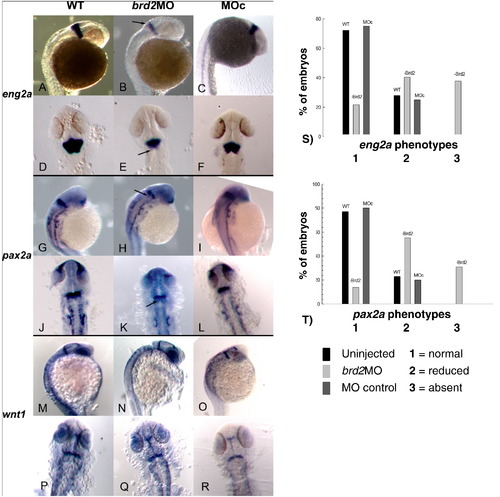
Midbrain-hindbrain boundary gene expression is disrupted in prim5 brd2aMO morphants. In situ hybridization to RNA of MHB genes in wildtype uninjected (WT), brd2aMO1-injected (brd2aMO), and control MO-injected (MOc), embryos. For each target gene, a total of 30 embryos and three clutches per treatment were analyzed per treatments. In situ results for eng2a (A–C lateral view; D–F dorsal view), pax2a (G–I lateral view; J–L dorsal view), and wnt1 (M–O lateral view; P–R dorsal view). The hindbrain half of the MHB expression domain of both eng2a and pax2a is reduced in intensity or absent in brd2aMO morphants (arrows in B,E and H,K). Penetrance and expressivity of eng2a and pax2a phenotypes are analyzed in S) and T), respectively. Expression levels were scored as 1 (normal), 2 (reduced), or 3 (absent), and numbers of embryos in each category were evaluated statistically. brd2aMO1 morphants show a higher percentage of category 2 and 3 mutant phenotypes, while WT and MOc embryos show predominantly category 1 normal phenotypes for both eng2a and pax2a (p < 0.0001, chi square contingency), indicating that normal levels of Brd2a are necessary for the proper expression of these genes at MHB. |
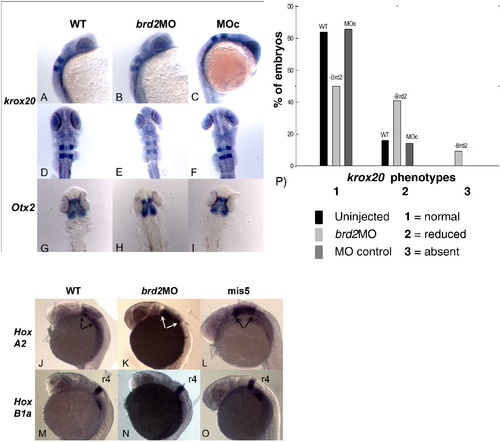
brd2aMO morphants show mostly normal expression of nearby markers in midbrain and hindbrain. In situ hybridization to midbrain (Otx2) and hindbrain (krox20, HoxA2b, HoxB1a) markers in wildtype uninjected (WT), brd2aMO1-injected (brd2MO), and control MOc or brd2aMO1mis5-injected embryos (MOc or mis5), using a total of three clutches and 15–30 embryos per treatment. In situ results for krox20 (A–C lateral view; D–F dorsal view), Otx2 (G–I dorsal view), HoxA2b (J–L lateral view), and HoxB1a (M–O lateral view) are shown. Expression of Otx2, HoxA2b, and HoxB1a is normal (H, K, N), while expression of krox20 is often reduced in intensity or absent medially in brd2aMO morphants (B, E). Penetrance and expressivity of the krox20 phenotype are shown in P). Expression phenotypes for krox20 were scored as 1 (normal), 2 (reduced), or 3 (absent medially), and numbers of embryos in each category were evaluated statistically. brd2aMO morphants show a higher percentage of category 2 and 3 mutant phenotypes, although differences from controls tested just below statistical significance (p = 0.0550, chi square contingency). Expression of markers on either side of anterior hindbrain r1 (Otx2, HoxA2b) remains within normal boundaries, as does expression of r4 HoxB1a marker between r3 and r5, indicating lack of expansion into eng2a- or krox20-vacated territory, respectively. Slightly reduced expression of these markers is occasionally observed. |
Suppression of cell death has little effect on disrupted eng2a expression in brd2aMO morphants. TUNEL assay and in situ hybridization to eng2a RNA in brd2aMO morphants in which cell death is suppressed by A–L) treatment with pan-caspase inhibitor Q-VD-OPh; or M–X) treatment with p53MO co-injection. For pan-caspase study: wildtype DMSO (A,B,C), Q-VD-OPh (D,E,F), brd2aMO (G,H,I), and brd2aMO + Q-VD-OPh (J,K,L) treated embryos were assessed for apoptotic nuclei by TUNEL assay followed by laser scanning confocal microscopy (brightfield A,D,G,J; darkfield B,E,H,K); and for eng2a expression by in situ hybridization (C,F,I,L). brd2aMO morphants exhibit reduced/absent eng2a expression in the anterior hindbrain domain compared to controls, regardless of the suppression of cell death by pan-caspase inhibition (arrows in I and L versus C and F). Refer to E for quantitative analysis. |
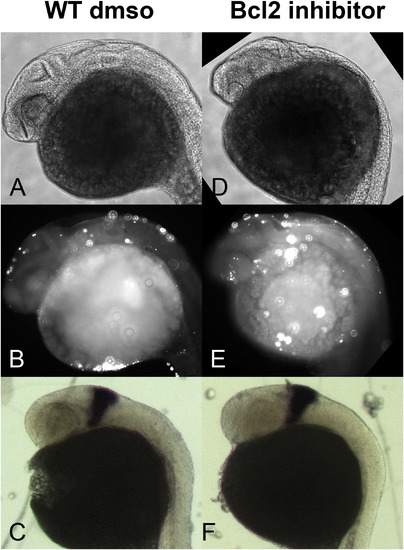
Induction of ectopic cell death is not sufficient to disrupt eng2a expression in the anterior hindbrain of wildtype embryos. TUNEL assay and in situ hybridization to eng2a RNA in wildtype embryos in which cell death is induced by Bcl2 inhibitor HA14–1. Wildtype DMSO (A,B,C) and HA14–1 (D,E,F) treated embryos were assessed for apoptotic nuclei by TUNEL assay followed by laser scanning confocal microscopy (brightfield A,D; darkfield B,E); and for eng2a expression by in situ hybridization (C,F). Embryos exhibit normal eng2a expression in the anterior hindbrain domain (C and F), regardless of the induction of higher levels of cell death by Bcl2 inhibitor treatment compared to controls (B versus E). Refer to F and for quantitative analysis. |
brd2aMO morphants exhibit disrupted patterning of hindbrain and spinal interneurons. Embryos from pax2a in situ to RNA experiments were examined to visualize various pax2a (+) cells along the A-P axis. Labeling of hindbrain and spinal interneurons by pax2a reveals A-P patterning of paired neurons on either side of the neural tube in wildtype uninjected (WT), control MOc-injected (MOc) and brd2aMO1-injected (brd2aMO) embryos. In wildtype embryos, neurons are perfectly matched 97.1% of the time, with only 2.9% showing 2–3 mismatched pairs (A); similar results are observed in the morpholino control MOc group (B). In contrast, neurons in brd2a knockdown embryos (C) are normally matched only 17.2% of the time, with 48.3% showing 2–3 mismatches, and 34.5% showing an unrecognizable pattern (p < 0.0001, chi square contingency). PHENOTYPE:
|
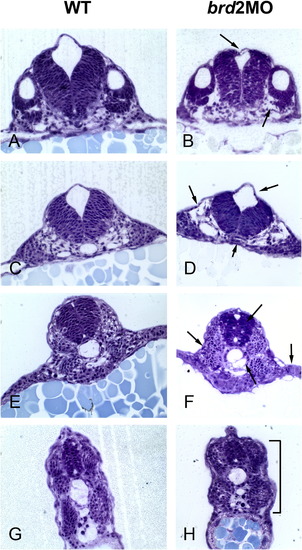
brd2aMO morphants exhibit abnormal tissue architecture in hindbrain, neural tube, somites and paraxial mesoderm. Transverse plastic sections through hindbrain (A–F) and trunk (G,H) of uninjected wildtype (WT) and 8 ng brd2aMO1-injected morphants (brd2aMO) were stained with toluidine blue and compared. A,B) show hindbrain at level of otic vesicle; C,D) and E,F) show progressively more caudal sections of hindbrain. brd2aMO1 morphants have collapsed ventricles (top arrows in B, D), disorganized, loosely packed mesoderm (bottom right arrow in B, top left arrow in D, left and right arrows in F), abnormal notochords (bottom arrows in D,F), and irregular, contracted somites (bracket in H). Although control-injected embryos were not compared directly in this analysis, the hindbrain and spinal cord irregularities we see here are corroborated by images of embryos obtained with BrdU and TUNEL staining, where samples of control-injected MOc embryos show tissue architecture similar to uninjected WT (see Results Section 2.3.2). PHENOTYPE:
|

ZFIN is incorporating published figure images and captions as part of an ongoing project. Figures from some publications have not yet been curated, or are not available for display because of copyright restrictions. PHENOTYPE:
|
Reprinted from Mechanisms of Development, 146, Murphy, T., Melville, H., Fradkin, E., Bistany, G., Branigan, G., Olsen, K., Comstock, C.R., Hanby, H., Garbade, E., DiBenedetto, A.J., Knockdown of epigenetic transcriptional co-regulator Brd2a disrupts apoptosis and proper formation of hindbrain and midbrain-hindbrain boundary (MHB) region in zebrafish, 10-30, Copyright (2017) with permission from Elsevier. Full text @ Mech. Dev.