
- Title
-
Rabconnectin-3a regulates vesicle endocytosis and canonical Wnt signaling in zebrafish neural crest migration
- Authors
- Tuttle, A.M., Hoffman, T.L., Schilling, T.F.
- Source
- Full text @ PLoS Biol.
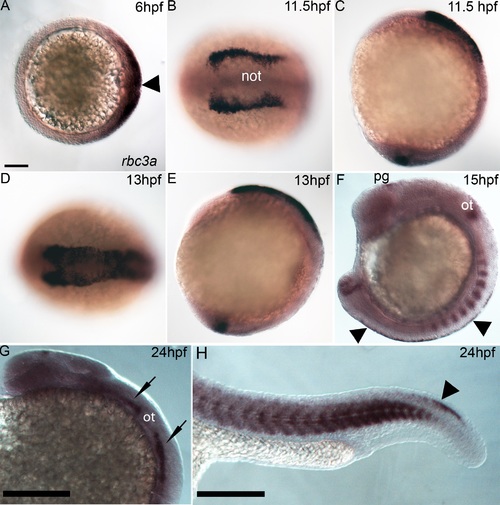
rbc3a expression. Whole mount in situ hybridization for rbc3a mRNA, anterior to the left. (A) Dorsal expression at gastrulation onset (6 hpf) includes the embryonic shield (arrowhead). Animal pole view, dorsal to the right. (B-E) Expression in NC cells starts at premigratory stages,11.5 hpf (B, C) and 13 hpf (D, E), with lower levels in the presumptive notochord (not) and in the tailbud (C, E). Dorsal views (B, D); lateral views (C, E). (F) Expression at 15 hpf in the pineal gland (pg), otic vesicle (ot), somites, tailbud, and premigratory NC (arrowheads) in the trunk. (G, H) Expression at 24 hpf in the pineal gland, cranial sensory ganglia (black arrows), somites, and tail NC (arrowhead). Scale bars, 100 µm. |

Rbc3a loss of function disrupts NC migration. (A-C) Live 24 hpf controls (A), rbc3a-MO1-injected (B), and rbc3aQ850X mutant (C) embryos. Morphant/mutant morphological defects include the mhb and cell aggregates in the dorsal midline (black arrows in B and C). (D-E′) NC defects in live sox10:gfp transgenics injected with rbc3a-MO1. (D, E) Merged bright-field and fluorescent images of the cranial region at 24 hpf, lateral views, show GFP+ NC cells accumulated dorsally (white arrowheads). (D′, E′) Dorsal views showing midline position of aggregates over the mhb and further posteriorly (white arrowheads). (F-Q) Whole mount in situ hybridization for markers of different NC lineages in controls (row 1), rbc3a-MO1-injected (row 2), and rbc3aQ850X mutants (row 3) at 28 hpf, dorsal views, anterior to the left. dlx2 (F-H) expression in skeletogenic NC and foxd3 (I-K) expression in gliogenic NC appear unaffected, while mitfa in presumptive melanocytes (L-N) and gch in xanthophores (O-Q) are expressed in dorsal midline aggregates in rbc3a morphants/mutants (white arrows). Abbreviations: 1-4, pharyngeal arches; ot, otic vesicle; mhb, midbrain-hindbrain boundary. Scale bars, 100 µm. |
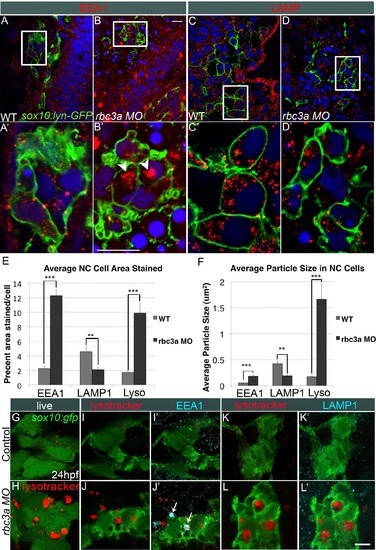
Rbc3a knockdown disrupts endosomal maturation but not acidification in NC. (A-D) Confocal images of whole mount immunohistochemical staining for endocytic markers in NC cells in sox10:lyn-gfp transgenics, which labels NC cell membranes (green). (A′-D′) 4× insets of (A-D). (A-B′) Anti-EEA1 marks early endosomes (red). rbc3a-MO1-injected embryos show large EEA1+ aggregates in NC cells (white arrowheads in B′). (C-D′) Anti-LAMP1 marks late endosomes/lysosomes (red). No increase in number or size of LAMP1+ vesicles was observed with rbc3a-MO1 injection. (E, F) Automated quantification of average % area (E) and average particle size (F) per NC cell stained positive for EEA1, LAMP1, or Lysotracker Red (Lyso) using ImageJ Particle Analyzer. rbc3a-MO1 injection produced significantly higher EEA1+ and Lysotracker+ relative area and particle size but significantly smaller LAMP1+ relative area and particle size per NC cell. Error bars represent ± SEM. (G, H) Live whole-mount images of sox10:gfp+ NC cells labeled with Lysotracker (red). rbc3a-MO1-injected embryos show many large, acidic Lyso+ vesicles, which colocalize with EEA1 (I′,J′, white arrows) but not LAMP1 (K′, L′). ** p<0.001, *** p<0.0001. Scale bar, 10 µm. PHENOTYPE:
|
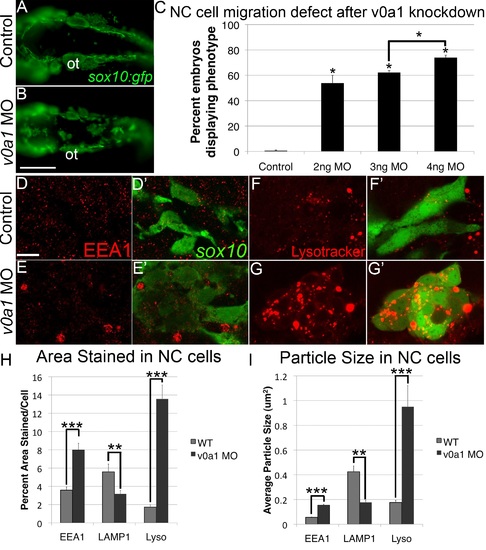
V0a1 knockdown disrupts NC migration and early endosome maturation. (A, B) Fluorescent images of live sox10:gfp embryos at 24 hpf, dorsal views, showing aggregates of GFP+ cells in the dorsal midline. Ot, otic vesicle. Scale bar, 100 µm. (C) Percentages of embryos with GFP+ aggregates in embryos injected with increasing amounts of v0a1-MO. (D-E′) EEA1 staining (red) in sox10:gfp+ NC cells (green), in controls (D, D′), and v0a1-deficient embryos (E, E′) showing EEA1+ vesicle enlargement at 24 hpf. Scale bar, 10 µm. (F-G′) Lysotracker staining (red) in sox10:gfp+ NC cells in controls (F, F′) and V0a1-deficient embryos (G, G′) showing enlarged acidic intracellular compartments in NC cells. (H, I) Automated quantification of average % area (H) and average particle size (I) per NC cell stained positive for EEA1, LAMP1, or Lysotracker Red (Lyso) using ImageJ Particle Analyzer. V0a1 knockdown produced significantly higher EEA1+ and Lysotracker+ relative area and average particle size but significantly less LAMP1+ relative area and particle size per NC cell. Error bars represent ± SEM. * p<0.05, ** p<0.001, *** p<0.0001. PHENOTYPE:
|
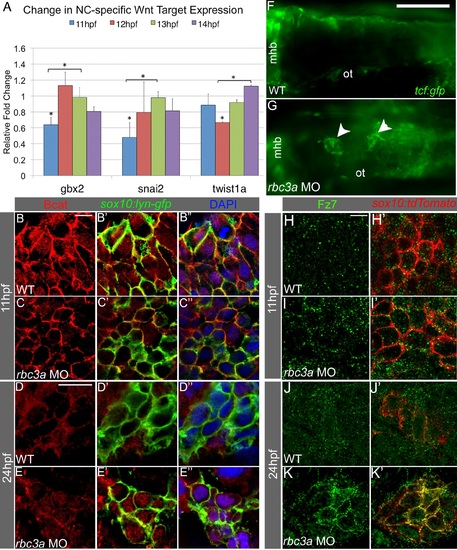
Rbc3a knockdown disrupts subcellular localization of Bcat and Fz7 in NC cells. (A) Quantitative RT-PCR analysis of early Wnt target genes with important roles in EMT reveals reduced expression of snai2, gbx2, and twist1a at 11-12 hpf in rbc3a-MO1-injected embryos. Error bars represent triplicate experiments ± SEM. * p<0.05. (B-E3) Immunostaining with an anti-Bcat antibody (red) in whole-mounted, sox10:lyn-gfp transgenic embryos to label NC cell membranes (green) and DAPI to label nuclei (blue). Bcat levels in the nucleus are (B-C3) reduced in rbc3a-MO1-injected embryos at 11 hpf and (D-E3) elevated in the nucleus of MO-injected embryos at 24 hpf compared with wild-type (WT) controls. Scale bar, 10 µm. (F, G) Dorsal images of tcf:gfp Wnt reporter transgenic fish at 24 hpf identifies distinct aggregates of GFP+ cells (white arrowheads) in the dorsal midline of rbc3a-MO1-injected embryos (G) but not wild-type (F) embryos. Mhb, midbrain-hindbrain boundary; ot, otic vesicle. Scale bar, 100 µm. (H-K′) Immunohistochemical staining for GFP (green) after microinjection of fz7-yfp mRNA in sox10:lyn-tdtomato (red) transgenic embryos. At both 11 hpf (H-I′) and 24 hpf (J-K′), the number of YFP+ puncta per cell increased in NC cells in rbc3a-MO1-injected embryos. YFP colocalizes with tdTomato at the membranes of NC cells in rbc3a-MO1-injected embryos at 24 hpf (K′). Scale bar, 10 µm. EXPRESSION / LABELING:
PHENOTYPE:
|
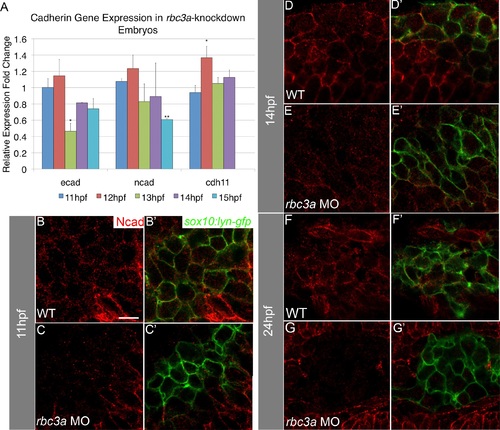
Rbc3a knockdown reduces expression of cadherins in NC cells. (A) Quantitative real-time PCR for ecad, ncad, and cdh11 at four timepoints during the onset of NC migration in rbc3a-MO1-injected embryos. ecad expression is significantly down-regulated at 13 hpf and remains low. ncad expression is also significantly reduced by 15 hpf. In contrast, cdh11 expression increases at 12 hpf. Error bars represent triplicate experiments ± SEM. (B-G′) Confocal images of immunohistochemical staining for Ncad (red) in sox10:lyn-gfp transgenics (green) at 11 hpf (B-C′), 14 hpf (D-E′), and 24 hpf (F-G′). Ncad levels are reduced at the membranes of GFP+ cells by 14 hpf in rbc3a-MO1-injected embryos and almost completely absent in the NC of rbc3a-MO1-injected embryos by 24 hpf, while still present at the membrane in surrounding cells. * p<0.05, ** p<0.01. Scale bar, 10 µm. EXPRESSION / LABELING:
|
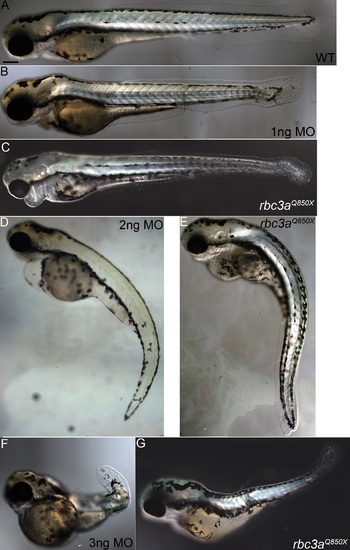
Rbc3a loss-of-function phenotype at 72 hpf. (A, B, D, F) Increasing amounts of rbc3a-MO1 (1-3 ng/embryo) leads to cardiac edema, reduced melanocytes, and shortened, curved tails in larvae at 72 hpf. (C, E, G) rbc3a mutant larvae show similar phenotypes. Scale bar, 200 µm. PHENOTYPE:
|

Rescue of rbc3a-MO1-injected embryos with full-length rbc3a mRNA. (A-C) Fluorescent images of live sox10:gfp transgenics, dorsal views, anterior to the left: (A) wild-type (WT), (B) rbc3a-MO1 injected, and (C) co-injected with full length rbc3a mRNA. (D) Number of GFP+ cells aggregated at the dorsal midilne at 24 hpf and located between the otic vesicle and MHB along the A-P axis. Injection of 100 pg rbc3a mRNA significantly rescued the number of GFP+ cells from 27.4±2.7 in rbc3a-MO1-injected embryos (n = 8) to 10.8±3.0 cells in mRNA+MO injected embryos (p<0.001, n = 8). Injection of 100 pg mRNA alone (n = 8) had no effect on the number of midline GFP+ cells compared to 2.3±1.7 in wild-type embryos (n = 9). Error bars represent ± SEM. Scale bar, 100 µm. PHENOTYPE:
|
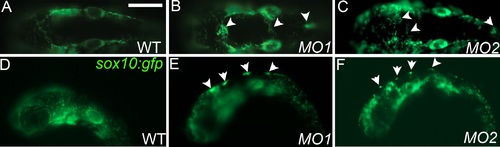
Injection of rbc3a-MO1 or -MO2 produces similar NC defects. (A-F) Live sox10:gfp embryos at 24 hpf, dorsal (A-C) and lateral (D-F) views, anterior to the left. Compared to wild-type embryos (A, D), embryos injected with either rbc3a-MO1 (B, E) or rbc3a-MO2 (C, F) display similar sox10:gfp+ dorsal midline cell aggregates (white arrowheads). PHENOTYPE:
|
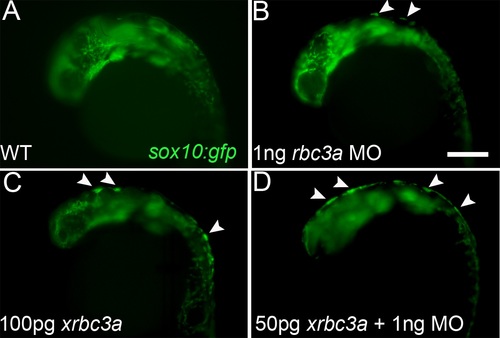
Injection of a 3′-truncated Xenopus rbc3a construct phenocopies Rbc3a loss of function. Fluorescent images of live sox10:gfp transgenics, lateral views, anterior to the left. (A, B) Injection of 1 ng/embryo of rbc3a-MO1 caused GFP+ cells to aggregate at the dorsal midline (arrowheads) by 24 hpf (41%, n = 7/17). (C) Injection of 100 pg/embryo of Xenopus rbc3a mRNA lacking 2.2 kb of the 3′ end of the ORF caused similar GFP+ dorsal aggregates (83%, n = 15/18). (D) Co-injection of 50 pg/embryo of truncated xrbc3a mRNA with 1 ng/embryo of rbc3a-MO1 increased the number and severity of embryos with GFP+ dorsal aggregates (79%, n = 11/14), with some embryos exhibiting a continuous strip of GFP+ cells all along the dorsal midline (36%, n = 5/14). |

Reduced NC cell motility in rbc3a-MO1-injected embryos. Individual frames from confocal time-lapsed movies of wild-type (A-E) and rbc3a-deficient (G-K) embryos from 13 hpf onwards in 20-min intervals. (F, L) Cell trajectories over 2 h of the corresponding cells in (A, F, and G-K). Wild-type NC cells (F) display stereotypical rapid, directed movement laterally and anteriorly, while many NC cells in rbc3a-MO1-injected embryos (L) adhere to each other and fail to migrate with other NC cells. (M) Average NC cell migration speed and (N) persistence of directionality (measured as the total displacement from the starting position of a cell over the total path length) at the onset of migration in wild-type and rbc3a-MO1-injected embryos (MO). Compared to wild-types, rbc3a-MO1 injection led to significantly reduced migration speed (p = 0.0028, 1.58±0.32 and 1.09±0.15 µm/min, respectively) and persistence (p = 0.015, 0.73±0.17 and 0.38±0.28, respectively). Error bars represent ±SEM. * p<0.05, ** p<0.01. PHENOTYPE:
|
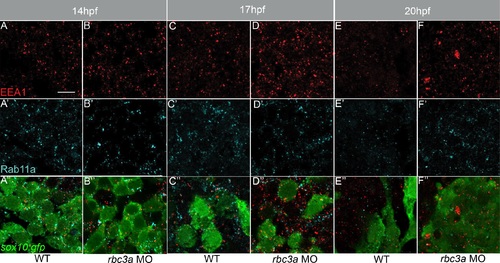
Enlarged early endosomes grow and accumulate over time in NC cells of rbc3a-MO1-injected embryos. Confocal images of sox10:gfp+ NC cells (bottom row, green) double labeled with anti-EEA1 (A-F, red) and anti-Rab11a (A′-F′, blue), which marks late endosomes. (A′′-F′′) Merged images of EEA1, Rab11a, and sox10:gfp fluorescence. EEA1+ vesicles increase in number and size in rbc3a-MO1-injected embryos from 14-20 hpf compared to wild-type controls, while Rab11a+ vesicles show no change. Scale bars, 10 µm. PHENOTYPE:
|
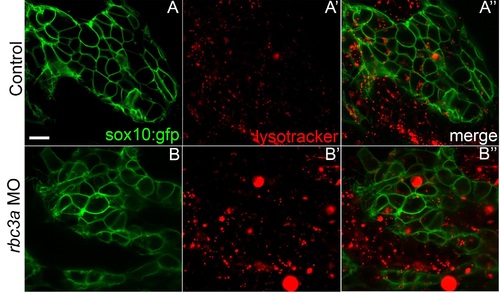
Enlarged early endosomes acidify in NC cells migrating into the pharyngeal arches of rbc3a-MO1-injected embryos. (A-B′′) Lateral view of live sox10:lyn-gfp transgenic embryos showing pharyngeal arches stained with Lysotracker-Red. NC cells in rbc3a-MO1-injected embryos contain larger and more Lysotracker-positive intracellular vesicles (B′, B′′) compared to controls. Scale bar, 10 µm. |
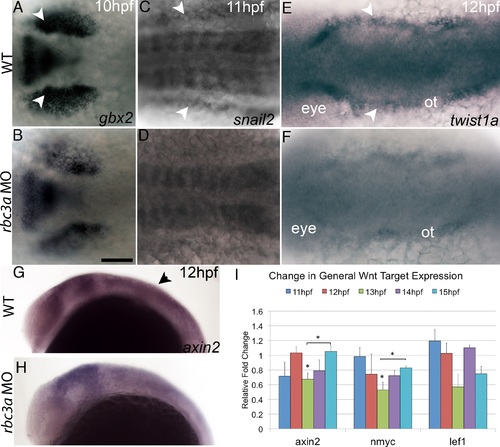
Changes in downstream Wnt target gene expression. (A-H) In situ hybridization for Wnt target gene expression in wild-type and rbc3a-MO1-injected embryos. Dorsal views (A-F), lateral views (G, H). Several genes display reduced expression in the NC (arrowheads) in rbc3a-MO1-injected embryos from 10-12 hpf including gbx2 (A, B), snail2 (C, D), twist1a (E, F), and axin2 (G, H). Scale bar, 100 µm. (I) axin2, nmyc, and lef1 show decreased expression by 13 hpf in rbc3a-MO1-injected embryos. Error bars represent triplicate experiments ± SEM. * p<0.05. |

Cell autonomous effects of Rbc3a knockdown. (A-C) Quantification of subcellular localization of (A) Bcat, (B) Fz7b-YFP, and (C) Ncad in NC and non-NC cells. ** p<0.01, *** p<0.001, N.S., not significant. (D) Wild-type host embryo at 24 hpf with sox10:lyn-tdtomato cells (red) transplanted from a rbc3a-MO1-injected donor, dorsal view. A subset of rbc3a-deficient donor cells formed dorsal midline aggregates (white arrowheads), but many other cells migrated properly into the pharyngeal arches (asterisk). Mhb, mindbrain-hindbrain boundary. Scale bar, 100 µm. |
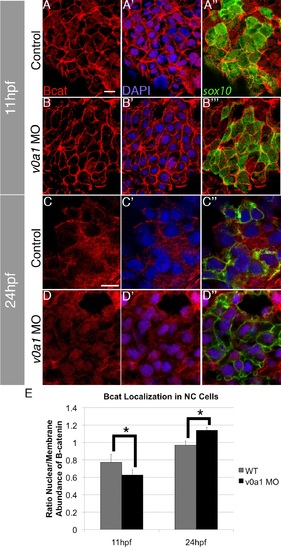
V0a1 knockdown disrupts nuclear localization of Bcat in NC. (A-D′′) Confocal images of sox10:gfp (green) embryos stained with DAPI (blue) and an anti-Bcat antibody (red) in uninjected controls (A-A′′, C-C′′) and embryos injected with v0a1-MO at 11 hpf (B-B′′) and 24 hpf (D-D′′). V0a1 knockdown reduces levels of B-cat in NC cell nuclei at 11 hpf (B-B′′) and nuclear Bcat at 24 hpf (D-D′′). Scale bars, 10 µm. (E) Quantification of the ratio of Bcat localization between NC cell membranes and nuclei indicates a significant decrease in nuclear localization in rbc3a-MO1–injected embryos at 11 hpf but a significant increase in nuclear localization at 24 hpf. Errors bars respresent ± SEM, * p<0.05. |