
- Title
-
ECM alterations in Fndc3a (Fibronectin Domain Containing Protein 3A) deficient zebrafish cause temporal fin development and regeneration defects
- Authors
- Liedtke, D., Orth, M., Meissler, M., Geuer, S., Knaup, S., Köblitz, I., Klopocki, E.
- Source
- Full text @ Sci. Rep.

ZFIN is incorporating published figure images and captions as part of an ongoing project. Figures from some publications have not yet been curated, or are not available for display because of copyright restrictions. EXPRESSION / LABELING:
PHENOTYPE:
|
|
ZFIN is incorporating published figure images and captions as part of an ongoing project. Figures from some publications have not yet been curated, or are not available for display because of copyright restrictions. |
|
ZFIN is incorporating published figure images and captions as part of an ongoing project. Figures from some publications have not yet been curated, or are not available for display because of copyright restrictions. EXPRESSION / LABELING:
PHENOTYPE:
|
|
ZFIN is incorporating published figure images and captions as part of an ongoing project. Figures from some publications have not yet been curated, or are not available for display because of copyright restrictions. EXPRESSION / LABELING:
PHENOTYPE:
|
|
ZFIN is incorporating published figure images and captions as part of an ongoing project. Figures from some publications have not yet been curated, or are not available for display because of copyright restrictions. EXPRESSION / LABELING:
PHENOTYPE:
|
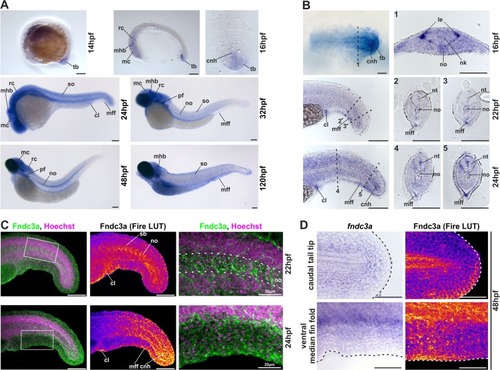
Localization of EXPRESSION / LABELING:
|
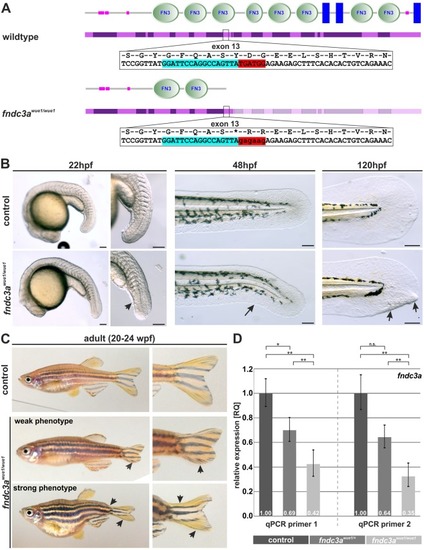
Generation and phenotype of PHENOTYPE:
|
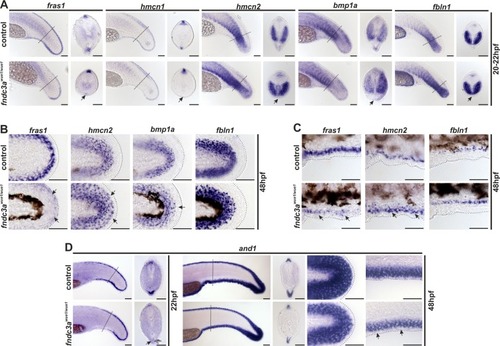
Normal development of the ventral median fin fold is altered in EXPRESSION / LABELING:
PHENOTYPE:
|
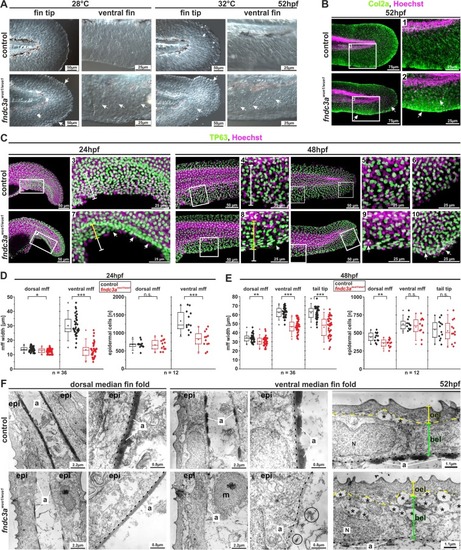
The |

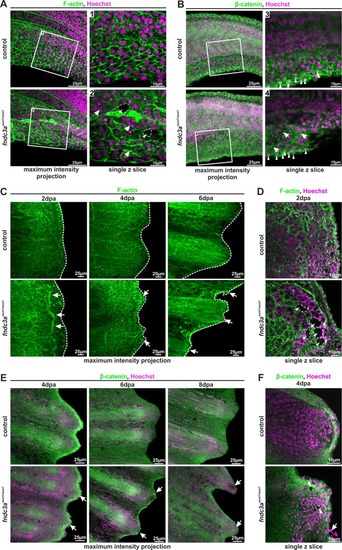
Interference with Fndc3a function during fin regeneration results in epidermal cells defects. ( |
Correct ECM structure in the median fin fold and regenerating caudal fins is hampered in EXPRESSION / LABELING:
PHENOTYPE:
|

Investigation of TGF-beta/BMP signals in the median fin fold of EXPRESSION / LABELING:
PHENOTYPE:
|