
- Title
-
The primary role of zebrafish nanog is in extra-embryonic tissue.
- Authors
- Gagnon, J.A., Obbad, K., Schier, A.F.
- Source
- Full text @ Development
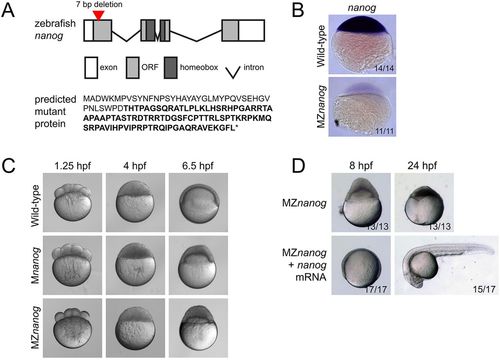
Generation and phenotype of MZnanog mutants. (A) Top: TALENs were used to generate a 7 bp deletion within the first exon of nanog. Exons, introns, the open reading frame (ORF) and the homeobox domain are indicated. Bottom: The predicted mutant protein sequence, with intact amino acids (40 of 384 total) in normal font and frameshifted amino acids in bold font. Asterisk indicates a premature stop codon. (B) In situ hybridization for nanog expression in wild-type and MZnanog embryos at sphere stage. (C) Wild-type, Mnanog and MZnanog embryos imaged at 1.25 hpf (8-cell stage), 4 hpf (sphere stage) and 6.5 hpf (shield stage in wild type). Epiboly defects in Mnanog and MZnanog are apparent at 6.5 hpf. (D) MZnanog embryos are shown at 8 hpf and at 24 hpf, either uninjected or injected with 5 pg nanog mRNA at the 1-cell stage. In B and D, the number of embryos exhibiting the illustrated phenotype is shown in the bottom-right corner of each image as a proportion of total embryos examined. |

The YSL is impaired in MZnanog embryos. (A) Yolk syncytial nuclei (YSN) were labeled by SYTOX Green dye injection into the yolk of 128-cell wild-type and MZnanog embryos, and imaged at 4 hpf and 6.5 hpf; n=7 for all conditions. Images on the right are magnifications of the boxed areas to the left. (B) The F-actin band, indicated with an asterisk, was visualized using phalloidin staining in fixed wild-type and MZnanog embryos at 8 hpf; n=8 for both wild type and MZnanog. (C) In situ hybridization for mxtx2 expression in wild-type and MZnanog embryos at sphere stage. The number of embryos exhibiting the illustrated expression pattern is shown in the bottom-right corner of each image as a proportion of total embryos examined. (D) Fold expression change for mxtx2, slc26a1, gata3 and hnf4a comparing wild-type and MZnanog embryos at 4 hpf (sphere stage) using RT-qPCR. Error bars show s.d. for three technical replicates (ten embryos per replicate). (E) Differential expression of genes expressed in the YSL, comparing wild type and MZnanog at 6.5 hpf using RNAseq. All genes are in gray, YSL-expressed genes are in black and were previously defined (Xu et al., 2012), and filtered for zygotic expression (Rabani et al., 2014). (F) Differential expression of zygotically expressed housekeeping genes (Lee et al., 2013), comparing wild type and MZnanog at shield stage using RNAseq. All genes are in gray, housekeeping genes are in black. Only those genes with wild-type mRNA expression >1 fragments per kilobase of transcript per million mapped reads (FPKM) are plotted. Genes are categorized as up- or downregulated if their expression in MZnanog differs more than 2-fold from that in wild type. (G) Distribution of fold changes derived from RNAseq data comparing wild-type and MZnanog embryos for all YSL (blue) and housekeeping (HK; red) genes visualized using a kernel density estimation. The displayed P-value (P=7.5×10⁶) comparing these two sets was calculated using a Student's two-tailed t-test. Scale bars: 100 μm. EXPRESSION / LABELING:
PHENOTYPE:
|

Defects in early zygotic gene expression in MZnanog embryos. (A) In situ hybridization for bmp2b and vox expression in wild-type and MZnanog embryos at sphere (4 hpf) stage. (B) Fold expression change for the indicated genes comparing wild type and MZnanog at sphere stage using RT-qPCR. Error bars show s.d. for three technical replicates (ten embryos per replicate). (C) Differential expression of early zygotic genes, comparing wild type and MZnanog at sphere stage using RNAseq. All genes are in gray, early zygotic genes (MZT genes) in black were previously defined (Lee et al., 2013). (D) Differential expression of maternally provided genes, comparing wild type and MZnanog at sphere stage using RNAseq. All genes are in gray, maternally provided genes in black were previously defined (Rabani et al., 2014). Only those genes with wild-type mRNA expression >1 FPKM are plotted. Genes are categorized as up- or downregulated if their expression in MZnanog differs more than 2-fold from that in wild type. (E) Distribution of fold changes between wild-type and MZnanog embryos for all early zygotic (blue) and maternal (red) genes visualized using a kernel density estimation. The displayed P-value comparing these two sets was calculated using a Student's two-tailed t-test. |
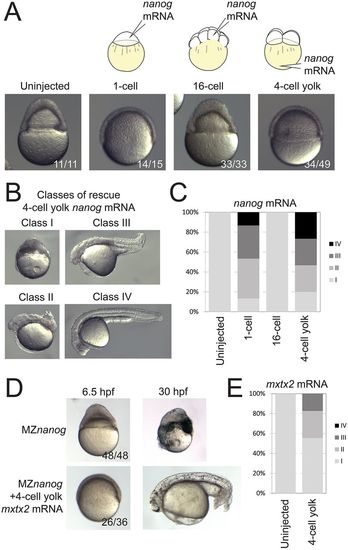
Rescue of MZnanog embryos by YSL expression of nanog or mxtx2 mRNA. (A) Uninjected MZnanog embryos, or MZnanog embryos injected with 33 pg GFP mRNA and 25 pg nanog mRNA into the cell at the 1-cell stage, into a cell at the 16-cell stage, or into the vegetal yolk at the 4-cell stage, were sorted for appropriate spatial GFP expression at sphere stage (as shown in Fig. S1A), and scored and imaged at 8 hpf. (B) Embryos were scored at 24 hpf into four rescue phenotype classes as described in Materials and Methods. (C) Quantification of rescue phenotype scores illustrated as stacked bar plots (uninjected n=11; 1-cell n=15; 16-cell n=33; 4-cell yolk n=30). (D,E) Control MZnanog embryos, or embryos injected into the vegetal yolk at the 4-cell stage with 33 pg GFP mRNA and 50 pg mxtx2 mRNA, were sorted for appropriate spatial GFP expression at sphere stage, scored as above, and imaged at 6.5 hpf and at 30 hpf (D). These scores were quantified and illustrated as stacked bar plots (E) (control n=48; 4-cell yolk n=92). In A and D, the number of embryos exhibiting the illustrated phenotype is shown in the bottom-right corner of each image as a proportion of total embryos examined. |
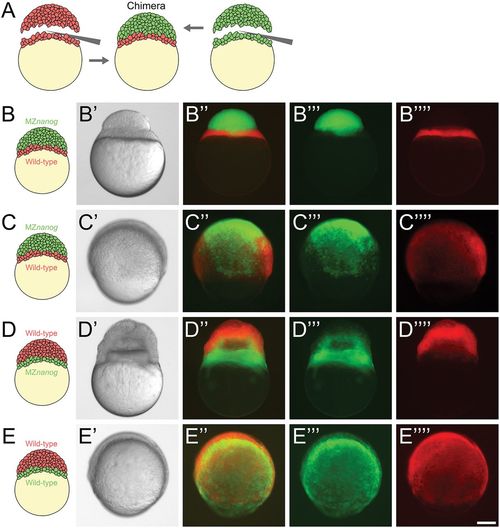
Blastoderm transplants between wild-type and MZnanog embryos. (A) Diagram of the blastoderm transplant. Donor embryos were injected with dextran-Alexa-488 or dextran-Alexa-546. Blastoderms were separated from yolks and combined to generate chimera embryos. (B) A chimera imaged approximately 15 min after transplant of a wild-type yolk cell and YSL with MZnanog blastoderm (B-B″″), where MZnanog tissue is labeled in green (B‴) and wild-type tissue is labeled in red (B″″). (C) A chimera at 8 hpf of a wild-type yolk cell and YSL with MZnanog blastoderm (C-C″″), where MZnanog tissue is labeled in green (C‴) and wild-type tissue is labeled in red (C″″). (D) A reciprocal chimera at 8 hpf of wild-type blastoderm with MZnanog yolk cell (D-D″″), again with MZnanog tissue labeled in green (D‴) and wild-type tissue labeled in red (D″″). (E) A chimera at 8 hpf of a wild-type yolk cell and YSL with a wild-type blastoderm from a second embryo (E-E″″), where tissue derived from each donor embryo is distinctly labeled (E‴,E″″). Composites of the fluorescent channels are shown in B″, C″, D″ and E″. Scale bar: 100 μm. |
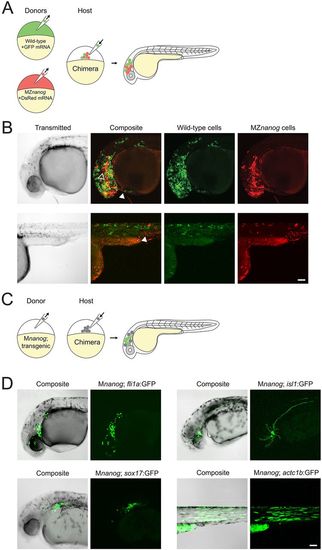
Transplantation of cells lacking Nanog into wild-type host embryos. (A) Diagram of co-transplantation of wild-type and MZnanog cells into wild-type host embryos, indicating their contribution to the host embryo. (B) Approximately 20 cells were transplanted from donor embryos (at 3-4 hpf) injected at the 1-cell stage with GFP mRNA (wild type) or DsRed mRNA (MZnanog) together into uninjected wild-type host embryos (n=27 across three independent trials). At 30 hpf, embryos were anesthetized, mounted and imaged by confocal microscopy. Two representative embryos are pictured, with arrowheads indicating contributions to eye (black arrowhead, upper row), hatching gland (white arrowhead, upper row), and muscle fibers (white arrowhead, lower row). (C) A diagram of transplantation of Mnanog; transgenic cells into a wild-type host embryo, with green cells in the host embryo indicating activation of the transgene in transplanted cells. Donor embryos (‘Mnanog; transgenic’) were the progeny of a Znanog female crossed to a transgenic male. (D) Approximately 20 cells were transplanted from donor embryos into uninjected wild-type host embryos. At 30 hpf, embryos were anesthetized, mounted and imaged by confocal microscopy. Representative embryos in all panels are displayed as maximum projections from a subset of a z-stack, with transgene or tracer expression overlaid onto the other channel or transmitted light channel for context (‘Composite’). Transgenic lines used were Tg(fli1a:GFP)y1 (n=11; Lawson and Weinstein, 2002), Tg(sox17:GFP)s870 (n=4, Sakaguchi et al., 2006), Tg(isl1:Gal4-VP16;UAS:GFP)zf154 (abbreviated isl1:GFP) (n=16; Sagasti et al., 2005) and Tg(actc1b:GFP)zf13 (n=5; Higashijima et al., 1997). Wild-type expression patterns for each transgene are shown in Fig. S4 for comparison. Scale bars: 100 μm. |
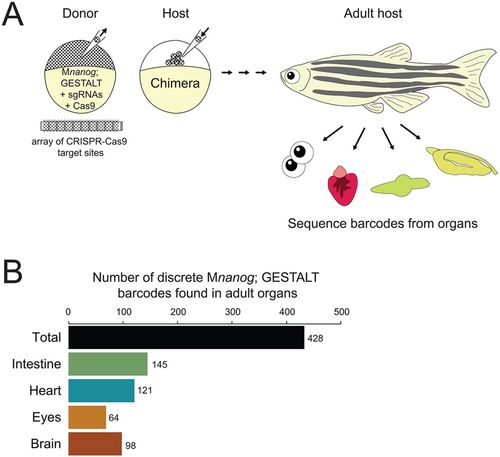
Long-term GESTALT fate mapping of transplanted cells lacking Nanog. (A) Diagram of cell transplantation at sphere stage from a Mnanog; GESTALT barcoded donor embryo into a wild-type host embryo. The donor embryo was injected with sgRNAs targeting CRISPR-Cas9 sites in the GESTALT barcode array. Host animals were grown to 90 days post-fertilization, when intestine, heart, eyes and brain were dissected (n=20 animals across two independent trials). Genomic DNA was prepared and barcodes (corresponding to surviving descendants of Mnanog; GESTALT transplanted cells) were sequenced from each organ. (B) After sequence processing of libraries from each organ across all 20 adults, distinct barcodes corresponding to different clones of transplanted Mnanog; GESTALT cells were counted. Shown is a summary of all 428 clones of Mnanog; GESTALT cells found in host animal organs. |
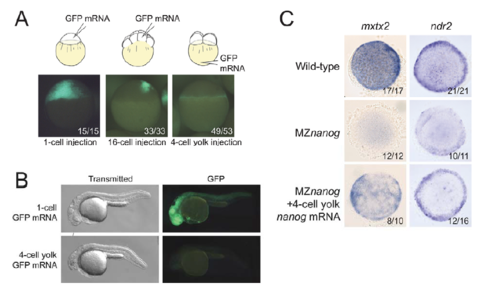
Predominant expression in the YSL after 4-cell yolk mRNA injection. A. MZnanog embryos were injected with 33 pg GFP mRNA and 25 pg nanog mRNA at 1-cell stage, 4-cell stage in vegetal yolk, or in 1 of the cells at 16-cell stage. At sphere (4 hpf) stage, embryos were imaged and scored for spatial GFP expression. B. Representative rescued embryos (as indicated) were imaged at 24 hpf for GFP expression in embryonic tissues. C. In situ hybridization for mxtx2 and ndr2 expression at 4.5 hpf (dome / 30% stage) in wild-type, MZnanog, and MZnanog embryos injected with nanog mRNA into the vegetal yolk at the 4-cell stage. |
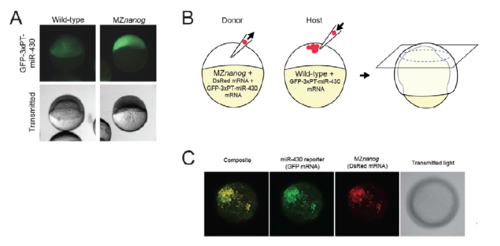
A cell autonomous requirement for nanog for miR-430 activity. A. Wild-type and MZnanog embryos were injected at the 1-cell stage with 100 pg GFP-3xPT-miR-430 mRNA, which contains three targets sites for miR-430 in the 3’ UTR. Images were taken at 6.5 hpf, and representative images are shown for each genotype (wildtype n=28; MZnanog n=11). B. A diagram of transplantation of MZnanog cells (injected with DsRed mRNA and GFP miR-430 reporter mRNA) into wild-type host embryos (injected only with GFP miR-430 reporter mRNA). Transplants were performed at 3-4 hpf, and embryos were imaged at 8 hpf. Donor cell contribution to the host embryo is detected by DsRed expression. C. A representative transplant host embryo imaged at the animal pole (from 3 independent experiments, n=33). GFP miR-430 reporter expression is repressed in wild-type host cells but detected in transplanted MZnanog cells (co-expressing DsRed). |
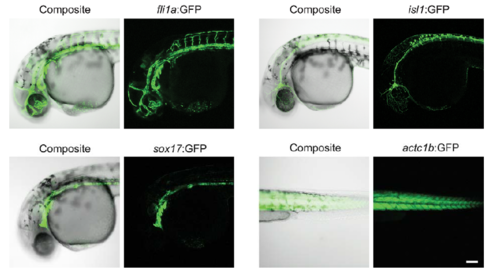
Transgene expression in wild-type embryos. For comparison with transplanted cells in Figure 6D, representative wild-type transgene expression patterns are shown at 30 hpf, imaged and processed as in Figure 6D. Scale bar indicates 100 microns. |
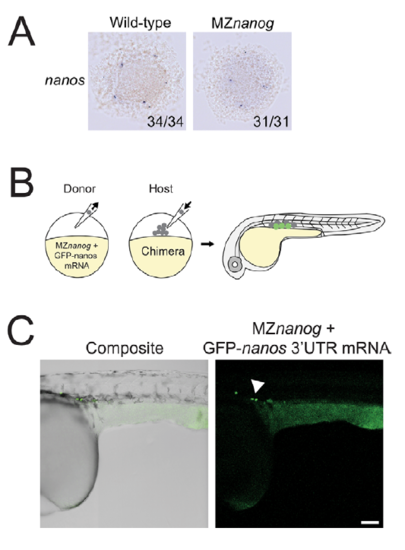
MZnanog germ cells are specified and migrate correctly when transplanted into wild-type host embryos. A. In situ hybridization for nanos expression at sphere stage in wildtype and MZnanog embryos. B. A diagram of transplantation of cells from MZnanog embryos injected with 50 pg GFP-nanos1 3’UTR mRNA (“GFP-nanos”, Köprunner et al., 2001) into a wild-type host embryo, with green cells in the host embryo indicating expression of the mRNA in transplanted cells at 30 hpf. C. Approximately 20 cells were transplanted from donor injected embryos into uninjected wild-type host embryos. At 30 hpf, embryos were anaesthetized, mounted, imaged, and processed as in Figure 6D (n=6). Germ cells are indicated with an arrowhead. Scale bar indicates 100 microns. |