
- Title
-
A Hox gene controls lateral line cell migration by regulating chemokine receptor expression downstream of Wnt signaling
- Authors
- Breau, M.A., Wilkinson, D.G., and Xu, Q.
- Source
- Full text @ Proc. Natl. Acad. Sci. USA
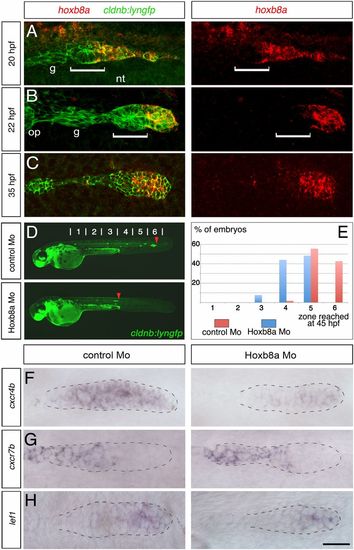
hoxb8a is required for proper migration of the posterior lateral line primordium and expression of the chemokine receptor cxcr4b. Anterior to the left. Detection of hoxb8a mRNA (red) in cldnb:lyngfp embryos (green) at (A) 20, (B) 22, and (C) 35 hpf. Dorsal view in A, lateral views in B and C. White brackets indicate the width of the first forming proneuromast (L1). (D) Fuorescence images of cldnb:lyngfp embryos at 45 hpf injected with control and hoxb8a Mo. Red arrowheads indicate the position of the primordium. (E) Quantification of the migration of the primordium at 45 hpf (control Mo, n = 54; hoxb8a Mo, n = 91). ISH to detect expression of (F) cxcr4b, (G) cxcr7b, and (H) lef1 at 30 hpf. The primordium is outlined with dotted line. g, Posterior lateral line sensory ganglion; op, otic placode; nt, neural tube. (Scale bar: 25 �m.) EXPRESSION / LABELING:
PHENOTYPE:
|

Overexpression of Hoxb8a leads to down-regulation of cxcr7b. (A) Fluorescent images of cldnb:lyngfp in cldnb4.2:gal4 x UAS:Hoxb8aMT embryos and control siblings at 45 hpf. The blue arrowhead shows the yolk defect seen in all cldnb4.2:gal4 x UAS:Hoxb8aMT embryos. Red arrowheads indicate the position of the primordium. (B) Quantification of the migration at 45 hpf (control, n = 20; cldnb4.2:gal4 x UAS:Hoxb8aMT, n = 26). Expression of (C) cxcr4b, (D) cxcr7b, and (E) lef1 in cldnb4.2:gal4 x UAS:Hoxb8aMT and control siblings at 28 hpf. ISH was followed by Myc immunostaining (brown). (Scale bar: 25 �m.) |
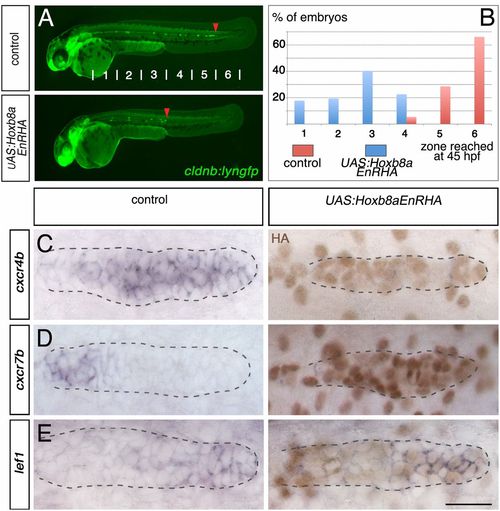
Dominant repressor Hoxb8a down-regulates the expression of cxcr4b and cxcr7b. (A) Fluorescent images of cldnb:lyngfp in cldnb4.2:gal4 x UAS:Hoxb8aEnRHA embryos and control siblings at 45 hpf. Red arrowheads indicate the position of the primordium. (B) Quantification of the migration at 45 hpf (control, n = 56; cldnb4.2:gal4 x UAS:Hoxb8aEnRHA, n = 62). Expression of (C) cxcr4b, (D) cxcr7b, and (E) lef1 in cldnb4.2:gal4 x UAS:Hoxb8aEnRHA and control siblings at 30 hpf. ISH was followed by HA immunostaining (brown). (Scale bar: 25 �m.) |

Dominant activator Hoxb8a activates cxcr4b expression and down-regulates cxcr7b. (A) Fluorescent images of cldnb:lyngfp in cldnb4.2:gal4 x UAS:Hoxb8aVP16 embryos and control siblings at 45 hpf. Blue arrow shows the morphological eye defect observed in all Hoxb8aVP16 embryos. Red arrowheads indicate the position of the primordium. (B) Quantification of the migration at 45 hpf (control, n = 50; cldnb4.2:gal4 x UAS:Hoxb8aVP16, n = 56). ISH showing expression of (C) cxcr4b, (D) cxcr7b, and (E) lef1 in cldnb4.2:gal4 x UAS:Hoxb8aVP16 and control siblings at 28 hpf. (Scale bar: 25 �m.) |

Hoxb8a is a target of Wnt signaling and is sufficient to down-regulate cxcr7b upon inhibition of Wnt pathway. ISH showing expression of (A and B) lef1, (C and D) hoxb8a, (E and F) hoxb6a, (G and H) cxcr4b, and (I and J) cxcr7b in hsp70:dkk1gfp embryos and control heat-shocked siblings. Embryos were heat-shocked at 24 hpf and fixed at 30 hpf. ISH to detect expression of (K) cxcr4b and (M) cxcr7b followed by Myc immunostaining (brown) in hsp70:dkk1gfp/cldnb4.2:gal4 x UAS:Hoxb8aMT embryos. ISH to detect expression of (L) cxcr4b and (N) cxcr7b in hsp70:dkk1gfp/cldnb4.2:gal4 x UAS:Hoxb8aVP16 embryos. The number of embryos indicated are pooled from three independent experiments and they are as follows: A, 57; B, 60; C, 62; D, 58; E, 41; F, 63; G, 66; H, 40; I, 67; J, 67; K, 23; L, 55; M, 38; N, 46. (Scale bar: 25 �m.) EXPRESSION / LABELING:
|

Expression pattern of hox genes in the posterior lateral line primordium. (A-O) Expression of hoxb8a, hoxb6a, hoxc8a, hoxd4a, and hoxc4a detected by in situ hybridization (ISH) at 18 or 20 h postfertilization (hpf), 26 hpf, 35 hpf, and 45 hpf. Dorsal view at 18 and 20 hpf and lateral view at later stages. The primordium is outlined with dotted line. (P-S) Fluorescent detection of hoxb8a (blue) and hoxb6a (red) mRNA in cldnb:lyngfp (green) embryos at 20 (P and Q, dorsal view) and 26 hpf (R and S, lateral view). White bracket in P and Q indicates the width of the first proneuromast (L1). (T) Summary of spatiotemporal expresssion of hox genes during migration of the primordium. (Left) The developmental stages and extent of the primordium migration, with the hox expression domain in the leading zone indicated in black. (Right) Table shows when different hox genes are expressed; hoxc6a expression pattern is similar to that of hoxc8a. g, Posterior lateral line sensory ganglion; nt, neural tube. (Scale bars: 25 �m.) EXPRESSION / LABELING:
|

Hoxb8a knockdown leads to reduced proliferation in the primordium. BrdU incorporation (red) in cldnb:lyngfp (green) embryos in (A) control and (B) Hoxb8a morphants at 24 hfp. The leading zone is defined as the region containing primordium cells caudal to the first forming proneuromast L1. Histograms of the total cell number in (C) L1 and (D) the leading zone of control (n = 11) and Hoxb8a (n = 10) morphant primordia at 24 hpf. Histograms showing the proportion of BrdU postitive cells in (E) L1 and (F) the leading zone of control (n = 11) and Hoxb8a (n = 10) morphant primordia at 24 hpf. **P < 0.005; ***P < 0.001. |

No change in expression of Fgf pathway components in Hoxb8a morpants. ISH to detect expression of (A) pea3, (B) fgf10, (C) fgf3, (D) fgfr1, and (E) sef1 in control and Hoxb8a morphant embryos at 30 hpf. (Scale bars: 25 �m.) EXPRESSION / LABELING:
|
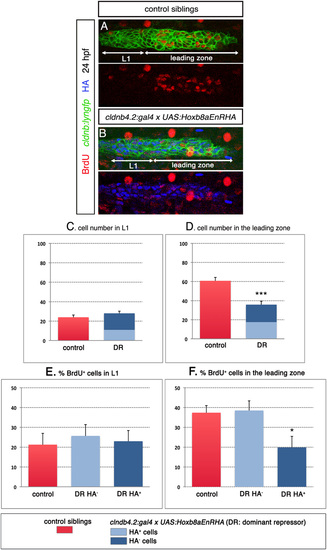
Overexpression of Hoxb8aEnRHA in the primordium decreases proliferation in a cell-autonomous manner. (A and B) BrdU (red) and HA (blue) double immunostaining in cldnb:lyngfp (green) and cldnb4.2:gal4 x UAS:Hoxb8aEnRHA embryos and control siblings at 24 hfp. Histograms of cell number in (C) L1 and (D) the leading zone of cldnb4.2:gal4 x UAS:Hoxb8aEnRHA embryos (n = 7) and control siblings (n = 7) at 24 hpf. For cldnb4.2:gal4 x UAS:Hoxb8aEnRHA primordia, dark and light blue boxes represent the numbers of HA positive and negative cells, respectively. Histograms showing the proportion of BrdU postitive cells in (E) L1 and (F) the leading zone of cldnb4.2:gal4 x UAS:Hoxb8aEnRHA (n = 7) and control siblings (n = 7) at 24 hpf. For cldnb4.2:gal4 x UAS: Hoxb8aEnRHA primordia, dark and light blue bars represent the proportion of BrdU positive cells among HA positive and negative cells, respectively. *P < 0.05; ***P < 0.001. |