
- Title
-
The zebrafish down syndrome cell adhesion molecule is involved in cell movement during embryogenesis
- Authors
- Yimlamai, D., Konnikova, L., Moss, L.G., and Jay, D.G.
- Source
- Full text @ Dev. Biol.
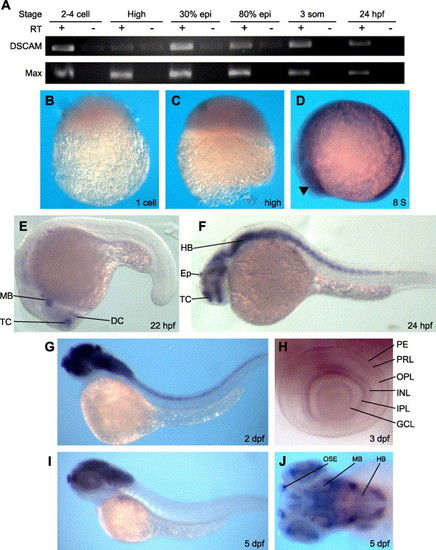
Expression of zebrafish dscam during early embryogenesis. (A) RT-PCR of dscam at various developmental stages within the first 24 h. Max is used as loading control. Whole mount in situ hybridization of wild-type embryos at (B) 1 cell, (C) high, (D) 8 somite, (E) 22 hpf, (F) 24 hpf, (G) 2 dpf, (H) high magnification of 3 dpf eye, (I) 5 dpf, and (J) anterior–dorsal view at 5 dpf. B–D show expression throughout the early embryo. Arrowhead in D indicates the presumptive eye field. (E) 22 hpf embryo shows initial dscam discrete expression within midbrain, diencephalon, and telencephalon. (F) 24 hpf embryo shows expanded dscam expression and new expression in hindbrain and spinal cord. (G) 2 dpf embryo shows expanding brain and spinal cord expression. (H) Multiple layers of the laminated eye show strong dscam expression, particularly IPL and INL. (I) 5 dpf embryo shows expression only in the brain. (J) High magnification dorsal view of the brain shows dscam expression is expressed discretely throughout. PE, pigmented epithelium; PRL, photoreceptor layer; OPL, outer plexiform layer; INL, inner nerve layer; IPL, inner plexiform layer; GCL, ganglion cell layer; Ep, epiphysis; DC, diencephalon; HB, hindbrain; MB, midbrain; TC, telencephalon; OSE, olfactory sensory epithelium. |

dscam protein is expressed early in development. (A) Immunoblot of anti-dscam polyclonal and monoclonal antibodies against Cos-7 cell lysates expressing dscam. Arrowhead indicates dscam at 220 kDa. (B) Secondary antibody alone, 32 cell stage. (C) α-dscam monoclonal, 32 cell stage. (D) Secondary antibody alone, 90% epiboly. (E) α-dscam monoclonal, 90% epiboly. EXPRESSION / LABELING:
|

Zebrafish dscam knockdown results in growth defects. (A) Grade 0 (G0), wild-type appearance. (B) Grade 1 (G1), mild growth defects. (C) Grade 2 (G2), moderate defects. (D) Grade 3 (G3), severe defects. (E) Western blot analysis of individual zebrafish injected with DS2Mmis (10 ng) or DS2M (10 ng). Arrowhead indicates dscam expression at 220 kDa. |

dscam morphants show axon tract defects. (A) G0 embryo shows normal axon tracts. (B) G1 embryo shows few neurons and disorganized axons. Ep, epiphysis; DC, diencephalon; SOT, supraoptic tract; TC, telencephalon; TPOC, tract of the post-optic commissure; TPC, tract of the posterior commissure. (C) Control and (D) dscam knockdown embryos at tailbud stage. Arrowhead represents tailbud. Arrow represents leading edge of the polster. |
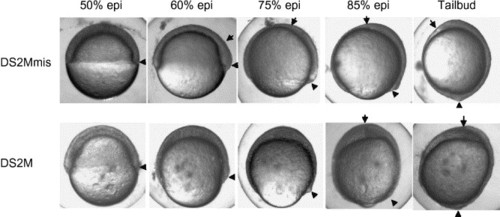
Time lapse images of control and dscam morphants during gastrulation. Images are of a single embryo photographed at the indicated stages. Arrowhead represents the tailbud. Arrow represents leading edge of the polster. |
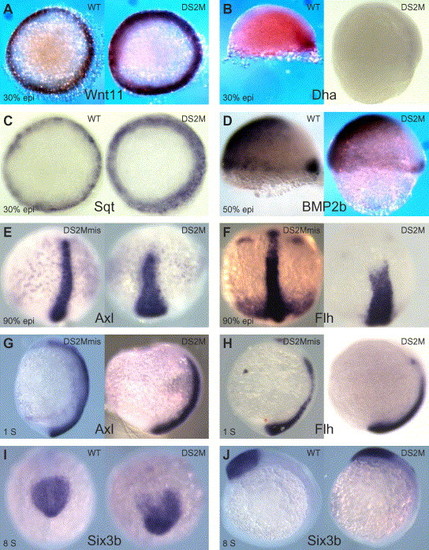
Marker gene in situ of dscam knockdown embryos. (A and C) Animal pole view. (B and D) Lateral view, dorsal is right, animal pole is up. (E and F) Dorsal view, tailbud is at the bottom. (G, H, and J) Lateral view, tailbud is at the bottom. (I) Rostral view. (A and C) Wnt11 and Squint/Nodal at 30% epiboly, respectively. (B and D) Dharma and Bmp2b at 50% epiboly, respectively. (E and F) Axial and floating head at 90% epiboly, respectively. (E and F) Axial and floating head at 1 somite, respectively. (I and J) Six3b at 8 somites. All controls show representative samples. DS2M injections show severe phenotype in at least five embryos in samples of twenty. EXPRESSION / LABELING:
|
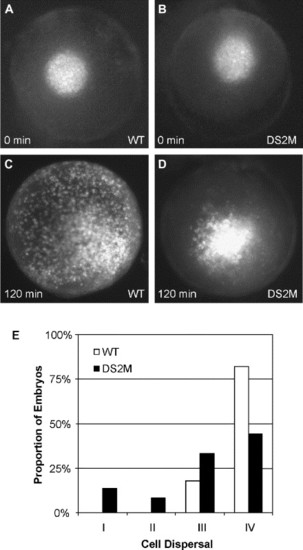
Dscam is required for cell dispersal during epiboly. (A) Wild-type embryo at high cell stage showing bright spot of FITC-dextran labeled cells after uncaging. (B) DS2M injected embryo at high cell stage showing a similar size spot of FITC-dextran labeled cells. (C) A wild-type embryo imaged after 2 h of development illustrating how cells within the original spot widely disperse across the embryo. This embryo is an example of Grade IV dispersal. (D) A DS2M embryo imaged 2 h after uncaging shows most cells contained within the original spot. Limited migration from the spot has occurred as the border of the original spot is irregular. This is an example of Grade I dispersal. (E) Microinjection of DS2M (n = 36) shifts population of embryos exhibiting less dispersal of cells within the uncaged spot toward Grade I as compared to wild-type embryos (n = 28). This shift is statistically significant by χ2, P = 0.01. Grade I, uncaged spot is condensed with slight cell migration. Grade II, spot is slightly dispersed. Grade III, spot is moderately dispersed. Grade IV, spot is widely dispersed. |

Unillustrated author statements EXPRESSION / LABELING:
|
Reprinted from Developmental Biology, 279(1), Yimlamai, D., Konnikova, L., Moss, L.G., and Jay, D.G., The zebrafish down syndrome cell adhesion molecule is involved in cell movement during embryogenesis, 44-57, Copyright (2005) with permission from Elsevier. Full text @ Dev. Biol.