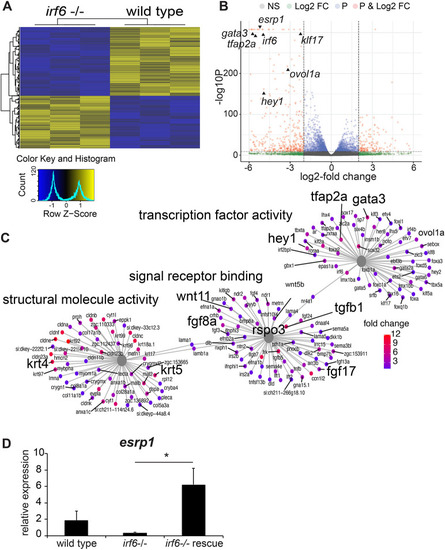
esrp1 expression is downregulated in irf6 null zebrafish embryos. (A) Hierarchical clustering of top differentially expressed genes (DEGs) defined by RNA-seq performed on wild-type (WT) versus mz-irf6-8bp/-8bp (irf6−/−) zebrafish embryos at 4-5 hpf. Top DEGs were identified by selecting genes with an adjusted P-value (Benjamini–Hochberg) <0.01 and absolute log2-fold change >2. Data are shown for three biological replicates. Color scale on the bottom left represents relative levels of expression, with yellow showing higher expression levels and blue showing lower expression. (B) Volcano plot from the RNA-seq dataset, showing the distribution of DEGs based on P-values (P) and log2-fold change (Log2 FC). NS, not significant. Previously published irf6-regulated genes are expressed at significantly higher levels in WT relative to mz-irf6−/−, including grhl3, klf17 and wnt11. The newly identified cleft-associated gene esrp1 is also expressed significantly higher in WT relative to irf6−/−. Vertical dashed lines represent the P-value cutoff of 0.01 and the log2-fold change cutoff of 2, respectively. (C) Gene ontology (GO) gene-concept network analysis of RNA-seq data, showing that irf6−/− embryos have perturbations in processes such as transcription factor activity, signal receptor binding and structural molecule activity. Note that many of these genes – such as wnt11, fgf8, tgfb1, krt4 and krt5 – are implicated in ectoderm development and cell specification. Gray nodes show GO terms, colored nodes show individual genes from the RNA-seq dataset, and black lines connect genes to one or more associated GO terms. Colored nodes show relative enrichment (measured by fold change) of genes in WT samples relative to irf6−/− embryos. Maps were generated using the enrichplot package in R. (D) qPCR gene expression analysis for esrp1, showing ∼80% downregulation in mz-irf6-8bp/-8bp embryos compared with WT at 4 hpf, and rescued esrp1 gene overexpression in mz-irf6-8bp/-8bp embryos injected with WT zebrafish irf6 mRNA. n=4. Unpaired Student’s t-test, *P<0.05.
|
