
Fig. 1
- ID
- ZDB-FIG-131101-17
- Publication
- Burkhalter et al., 2013 - Grk5l Controls Heart Development by Limiting mTOR Signaling during Symmetry Breaking
- Other Figures
- All Figure Page
- Back to All Figure Page
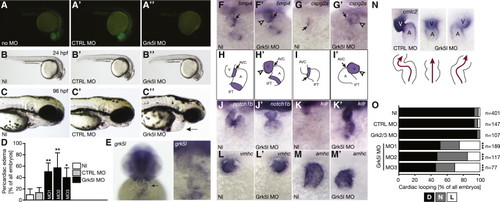
Grk5l KD in Zebrafish Affects Early Heart Development (A–A3) Grk5l MO prevents translation of coinjected RNA coding for Grk5l-GFP fused to parts of its 52 UTR and results in fish that show no glowing (A3), whereas RNA injection alone (A) or in combination with the CTRL MO (A2) produces strong GFP expression. (B–B 3) Zebrafish embryos (24 hpf) injected with Grk5l MO (B3) compared with NI embryos (B) and embryos injected with CTRL MO (B2). (C–C 3) Live embryos (96 hpf). Arrow indicates pericaridac edema in Grk5l morphants. (D) Bar graph displaying the percentage of embryos with pericardiac edema as mean ± SEM. n = 3–10 experiments, 76–340 embryos. CTRL MO versus Grk5l MO: p = 0.0023; CTRL MO versus Grk5l MO2: p = 0.0016; CTRL MO versus Grk5l MO3: p = 0.0213. (E) grk5l transcripts in the heart of 48 hpf zebrafish embryos (arrow and higher magnification). (F and F′) bmp4 transcripts are upregulated and dispersed throughout the heart of Grk5l morphants (F′). n = 10–35. (G and G2) Upregulation of cspg2a upon injection of Grk5l MO (G2). n = 16–18. (H and H2) Illustration of normal distribution of bmp4 in controls (H) and widespread expression in Grk5l morphants (H2). (I and I2) Cartoon showing both regular and aberrant distribution of cspg2a in controls (I) and Grk5l MO (I′) injected fish. (J and J2) Notch1b fails to accumulate in the future valve region upon Grk5l KD (J2). n = 16–25. (K and K2) Kdr is strongly upregulated upon KD of Grk5l (K2) compared with control fish (K). n = 5–22. (L and L2) Ventricular fate as shown by WMISH for vmhc is properly established when Grk5l is lost. n = 27–32. (M and M2) Amhc expression in the atrium. n = 18–23. (N) WMISH for cmlc2 at 50 hpf, revealing altered cardiac looping in Grk5l morphants (arrow). Cartoon depicts heart morphology and blood flow. A, atrium, V, ventricle. (O) Summary of heart looping after injection with MOs targeting either Grk2/3 or Grk5l. For Grk5l, three different MOs were tested. D, D-loop, N, no loop, L, L-loop. CTRL MO versus Grk5l MO: p < 0.0001; CTRL MO versus Grk5l MO2: p < 0.0001; CTRL MO versus Grk5l MO3: p < 0.0001. All images: 48–52 hpf (F–M). See also Figure S1 and Table S1. |
| Genes: | |
|---|---|
| Fish: | |
| Knockdown Reagent: | |
| Anatomical Terms: | |
| Stage: | Long-pec |
| Fish: | |
|---|---|
| Knockdown Reagents: | |
| Observed In: | |
| Stage Range: | Long-pec to Day 4 |