
Fig. 3
- ID
- ZDB-FIG-131101-20
- Publication
- Burkhalter et al., 2013 - Grk5l Controls Heart Development by Limiting mTOR Signaling during Symmetry Breaking
- Other Figures
- All Figure Page
- Back to All Figure Page
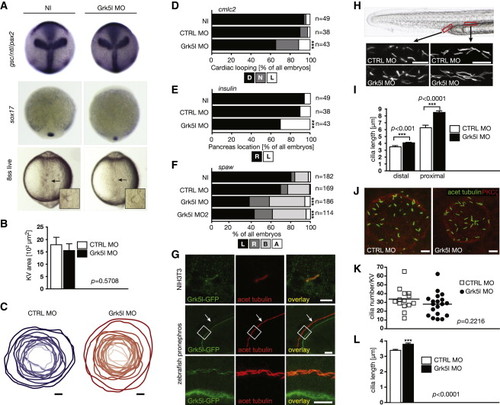
Grk5l Acts in the Organ of Laterality (A) Combined WMISH for gsc, ntl, and pax2 (10 hpf). DFCs cluster normally at 90% epiboly as shown by sox17 (n = 32–35). Live imaging at 8 ss shows that the KV forms. Arrows indicate KV; higher magnification in inset. (B) KV-specific KD did not alter KV area as assessed by PKCζ staining at 8 ss. n = 14–19 embryos. CTRL MO: 1,793 ± 299 μm2, Grk5l MO: 1,555 ± 277 μm2. Bar graph displays means ± SEM. (C) Outline of KVs upon injection of CTRL MO (blue) or Grk5l MO (red). Depending on the respective size, the KV is shown in darker or brighter shading. n = 12–17 embryos. (D) Impaired heart looping by Grk5l depletion in KV cells detected by cmlc2 ISH at 50 hpf. CTRL MO versus Grk5l MO: p < 0.0001. (E) insulin-positive cells of the pancreas are more often on the left side of the midline upon KV-specific KD of Grk5l. CTRL MO versus Grk5l MO: p = 0.0007. (F) KV-directed ablation of Grk5l randomizes spaw. CTRL MO versus Grk5l MO: p < 0.0001; CTRL MO versus Grk5l MO2: p = 0.0002. (G) Grk5l localizes to primary cilia in NIH 3T3 cells and motile cilia in the developing zebrafish kidney. Images show Grk5l-GFP after transfection in cells or injection of capped RNA into one-cell-stage embryos. Scale bars, 3 μm (NIH 3T3), 20 μm (low magnification of pronephros), and 10 μm (higher magnification). (H) Elongation of motile cilia of the zebrafish pronephros (2 dpf). Cilia in the distal (CTRL MO: 3.571 ± 0.116 μm, Grk5l MO: 4.090 ± 0.0852 ¼m) and proximal part (CTRL MO: 6.347 ± 0.318 μm, Grk5l MO: 8.526 ± 0.220 μm) were analyzed. Approximate areas of analysis are indicated in red in the live image of a 2 dpf zebrafish tail. Scale bar, 10 μm. (I) Bar graph summarizing pronephric cilia measurements as means ± SEM (n = 32–101 cilia). (J) Motile cilia at 8 ss with MOs targeted to KV cells. Images were selected for cilia length. Scale bar, 10 μm. (K) Cilia number was not altered in the KV by MOs targeted to the KV (8 ss). n = 14–19 embryos. CTRL MO: 34.14 ± 3.372 cilia; Grk5l MO: 28.53 ± 2.960 cilia. (L) Grk5l depletion in the KV increases cilia length. n = 460–513 cilia at 8 ss. CTRL MO: 3.344 ± 0.049 μm; Grk5l MO: 3.748 ± 0.054 μm; p < 0.0001, two-tailed, unpaired t test. Bar graph displays means ± SEM. See also Figure S2<. |
| Genes: | |
|---|---|
| Antibodies: | |
| Fish: | |
| Knockdown Reagent: | |
| Anatomical Terms: | |
| Stage Range: | 90%-epiboly to 5-9 somites |
| Fish: | |
|---|---|
| Knockdown Reagent: | |
| Observed In: | |
| Stage Range: | 5-9 somites to Long-pec |