
- Title
-
Loss of col4a1 in zebrafish recapitulates the cerebrovascular phenotypes associated with monogenic cerebral small vessel disease
- Authors
- Flatman, D., Naylor, R.W., Crilly, S., Carter, I., Mironov, A., Pinteaux, E., Allan, S.M., Lennon, R., Kasher, P.R.
- Source
- Full text @ Matrix Biol.

col4a1 crispant zebrafish larvae exhibit spontaneous brain haemorrhages A. Schematic representation of the col4a1 crispant experimental timeline. Crispants were injected as single cell zygotes with a cocktail of four gRNAs targeting the zebrafish col4a1 gene. B. The survival of zebrafish larvae as the mean percentage alive at various time points for col4a1 crispants injected with col4a1 gRNAs (red), compared to siblings injected with a control gRNA (grey) or left uninjected (black). Measurements commenced at 6 hpf after fertilisation was confirmed. The mean percentage was calculated from four experimental repeats. C. col4a1 gene expression analysis of col4a1 crispant larvae compared to control-injected and uninjected larvae was conducted using RNA extracted from whole larvae at 3 dpf. Relative mRNA expression was quantified using pooled whole larvae (n = 24 per sample). Individual points represent each result for each biological replicate (n = 5). D. Whole-mount in situ hybridisation of fixed bleached zebrafish larvae at 3 dpf with an antisense probe (purplish-blue signal) for col4a1 mRNA throughout the entire body (left) and in the heads (right). Scale bar = 200 µm. E. Lateral view of an ICH- control zebrafish and an ICH+ (white arrows) col4a1 crispant at 3 dpf. Images were acquired with a 6.3x objective, and the scale bar represents 100 µm. F. ICH was identified using brightfield microscopy and mean incidence of spontaneous ICH at 3 dpf from 7 biological repeats are shown as individual data points. G. col4a1 expression in whole zebrafish larvae at 3 dpf injected with either col4a1 targeting or control gRNAs and cas9 relative to uninjected controls. Before RNA extraction, col4a1 crispants were split into ICH+ or the ICH- group n = 23 larvae per group, per biological replicate, with each repeat shown as an individual point. H. Maximum intensity projection images of col4a1 crispants captured using light-sheet microscopy with a 20x objective and 1x digital zoom. Transgenic zebrafish larvae with fluorescent vasculature using false colours transgenic blood Tg(gata1:dsred) shown as magenta and endothelial cell-specific Tg(fli1:EGFP) shown as yellow in a dorsal orientation at 3 dpf. Controls were uninjected or injected with a control gRNA. Scale bar = 100 µm. B-C & F-G. Data were analysed using one-way ANOVA with mean displayed and error bars indicate the standard deviation of the mean. Asterisks denote means that are significantly different at the 5 % level, as determined by the Tukey HSD test: ns P > 0.05, **P ≤ 0.01, *** P ≤ 0.001 and **** P ≤ 0.0001. C&G. Gene expression was assessed by qRT-PCR and calculated using the comparative ΔΔCt method, normalising expression to both actin and gapdh housekeeper genes with expression shown relative to uninjected mRNA expression. EXPRESSION / LABELING:
PHENOTYPE:
|

col4a1 crispants display a spectrum of cerebrovascular defects at 3dpf. A. Table with the frequencies of observed cerebrovascular phenotypes in col4a1 crispant larvae at 3dpf. Visual classification of cerebrovasculature phenotypes in tg(kdrl:EGFP) larvae injected with a control gRNA, col4a1 targeting gRNA, or left uninjected, imaged in dorsal orientation using light sheet microscopy. Images from 7 biological replicates used. B. Inverted maximum intensity projections of the cerebrovasculature in larvae that have been labelled to highlight specific vessel abnormalities in 6 col4a1 crispants injected with col4a1 targeting gRNA. Scale bar is 100 µm. All images obtained on the Tg(kdrl:EGFP) background, except the top left, which is on the Tg(fli1:EGFP) background to illustrate fluorescence level differences. C. Heatmap schematic to illustrate missing vessels identified in col4a1 crispants generated on a Tg(kdrl:EGFP) background (n = 61). The intensity of red indicates the number of crispants that had that section of vessel missing, which was identified using maximum intensity projections of z-stacks from light sheet fluorescent microscopy. D. Heatmap for the location of ICH in col4a1 crispants. Haemoglobin was stained in col4a1 crispants with O-Dianisidine and imaged in a lateral orientation n = 48. The trace of each haematoma was laid on top of each other to create a heatmap in Adobe Illustrator. Dashed lines show the three main brain regions, and the scale indicates the frequency of ICH in each area. EXPRESSION / LABELING:
PHENOTYPE:
|
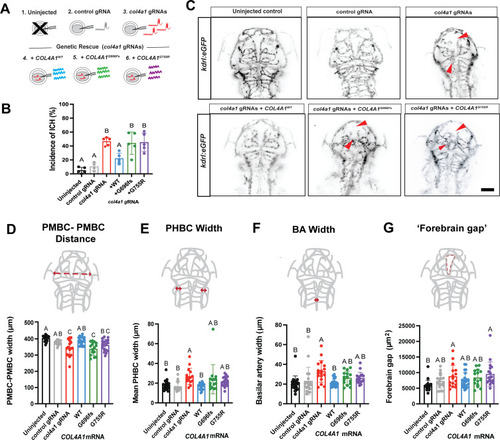
Human wild type COL4A1 mRNA can rescue certain cerebrovascular phenotypes in col4a1 crispants. A. Schematic summarising the injection groups used in mRNA rescue experiments. B. The incidence of ICH was measured as a percentage of the total larvae number. Wildtype zebrafish larvae were uninjected or microinjected with a control gRNA or 4 col4a1 targeting gRNAs to knock down col4a1 expression at the single-cell stage. col4a1 crispants were also co-injected with 30pg WT human COL4A1 mRNA or human pathogenic variants COL4A1G696fs and COL4A1G755R. Data shown is from 5 biological replicates with (n = 25–40). C. Representative images of the cerebral vasculature of Tg(kdrl:EGFP) zebrafish injected with a control gRNA or col4a1 gRNAs or left uninjected. A proportion of col4a1 crispants received an additional injection of either human WT COL4A1 mRNA or the human pathogenic variants COL4A1G696fs and COL4A1G755R. Vascular defects highlighted with a red arrow. The scale bar represents 100 µm. Larvae were dorsally orientated, and maximum intensity projections were presented from light sheet microscopy using a 20x objective and 1x digital zoom. D-G: Manual vascular measurements made of vascular parameters using maximum intensity projections Z-stacks of col4a1 crispants cerebrovasculature on the Tg(kdrl:EGFP) background. Specific measurements calculated include (D) distance between primordial midbrain channels (PMBC) (µm), (E) primordial hindbrain channel (PHBC) width (µm), (F) basilar artery (BA) width (µm) and (G) forebrain space (µm2). For each experimental group, n = 27–30 from three biological replicates, with each larval measurement plotted individually. B & D-H. Data analysed with one way ANOVA and presented as mean ± SD. Asterisks Letters A, B and C are compact letter displays to signify means that are significantly different at the 5 % level using the Tukey HSD test. EXPRESSION / LABELING:
PHENOTYPE:
|

Pharmacological inhibition of MMP9 rescues cerebrovascular defects and reduces haematoma expansion in col4a1 crispants. A. Relative levels of mmp9 transcript in col4a1 crispants. RNA extracted from 24 pooled whole zebrafish larvae at 3 dpf that were injected with either col4a1 targeting gRNAs or a control gRNA compared to uninjected siblings. Gene expression was calculated from RT-qPCR data using the comparative ΔΔCt method normalised to the gapdh and actin housekeepers and is relative to the uninjected control. Each data point is a biological repeat of which there were n = 9. Data were analysed with the Kruskal-Wallis test and Dunn’s post-hoc test. B. Representative inverted maximum intensity projections of the cerebrovasculature in Tg(kdrl: EGFP) col4a1 crispants treated with 0 or 2 µM MMP-9 inhibitor I (ab142180), and untreated control injected siblings. The zebrafish were live-imaged at 3 dpf using light-sheet microscopy in a dorsal orientation with a 20x objective and 0.7x digital zoom. The scale bar is 100 µm. C. The distance between both primordial midbrain channels (PMBC) vessels in µm. D. The mean width of the basilar artery (BA) measured in µm. E. The average width of the left and right primordial hindbrain channels (PHBC) measured in µm. F. The mean area in the forebrain absent of vessels measured in µm2. C-F. Data were analysed with the Kruskal-Wallis test and Dunn’s post-hoc test and presented as mean. Each data point is an individual fish (n = 30–36), results are from 3 biological replicates. Asterisks signify means that are significantly different at the 5 % level using the Tukey HSD test . G. The incidence of ICH in MMP9-inhibitor-I treated col4a1 crispants at 3 dpf compared to control injected siblings in larva stained with o-dianisidine. Data analysed with one-way ANOVA. Each value represents a pool of n = 25–50 embryos from 4 biological replicates. H. Representative image of an ICH+ col4a1 crispant stained with o-dianisidine at 3 dpf (haematoma indicated with white line). I. Haematoma area (µm2) quantification at 3 dpf in col4a1 crispants treated with 2 µM of MMP-9 inhibitor (n = 66) or without (n = 65). Data from 3 biological replicates and analysed with the Mann-Whitney T-test. For all tests ns P > 0.05, * P ≤ 0.05, **P ≤ 0.01, *** P ≤ 0.001 and **** P ≤ 0.0001. EXPRESSION / LABELING:
PHENOTYPE:
|

col4a1Δ20 mutant larvae have a milder neurovascular phenotype than crispants. A. Schematic representing the 20-base pair deletion at the exon 8/intron 8–9 boundary of the zebrafish col4a1 gene B. Representative maximum intensity projections of the developing cerebrovasculature in wildtype (col4a1+/+), heterozygous (col4a1+/Δ20) and homozygous (col4a1Δ20/Δ20) larvae on the Tg(kdrl: EGFP) background at 4 dpf. The zebrafish were live-imaged using light-sheet microscopy in a dorsal orientation with a 20x objective and 0.7x digital zoom. Images are a maximum intensity projection of a z-stack with an inverted greyscale image below. Different individual fish represent each genotype at each time point and the scale bar is 100 µm. Genotyping was performed after image acquisition. Abbreviations: PHBC- primordial hindbrain channel, PrA-porencephalic artery, PMBC- primordial midbrain channel. C. The distance between the left and right PMBC is reduced in col4a1Δ20/Δ20 larvae compared to col4a1+/+ siblings. D. Basilar artery (BA) width is increased in col4a1+/Δ20 and col4a1Δ20/Δ20 compared to wildtype col4a1+/+ siblings. E. The mean width of both PHBCs is increased in col4a1+/Δ20 and col4a1Δ20/Δ20 larvae compared to col4a1+/+ siblings. There is also a difference between col4a1+/Δ20 and col4a1Δ20/Δ20 siblings. F. The area of forebrain space is increased in col4a1Δ20/Δ20 larvae compared to col4a1+/+ siblings. C-F. Vascular measurements were made on maximum intensity projections from Z-stacks using FIJI. The larvae were live-imaged using light-sheet microscopy in a dorsal orientation with a 20x objective and 0.7x digital zoom. Genotyping was performed after image acquisition. n = 18–27 per group over 3 biological replicates with each larvae measurement plotted individually. Data were analysed with a one-way ANOVA. Asterisks signify means that are significantly different at the 5 % level using the Tukey HSD test ns P > 0.05, * P ≤ 0.05, **P ≤ 0.01, *** P ≤ 0.001 and **** P ≤ 0.0001. G. An o-dianisidine-stained col4a1Δ20/Δ20 larva at 3 days post fertilisation showing ICH (red arrows) and a 100 µm scale bar. H. Pie chart to show the expected Mendelian ratio of embryos from a heterozygous incross. I. Embryos from a col4a1+/Δ20 incross were treated with increasing concentrations of atorvastatin (ATV) at 1 dpf. At 2 dpf, embryos were stained with o-dianisidine to isolate ICH+ and ICH- embryos followed by genotyping. The percentage of ICH+ embryos from each genotype is written in white and the total number of ICH+ embryos are written below. Data are from two biological replicates. PHENOTYPE:
|

col4a1Δ20 mutant larvae exhibit a locomotor deficit. A. Schematic demonstrating the white light display performed by Daniovision software. B. Representative swimming tracks recorded from an aerial view using Daniovison software. C. col4a1+/Δ20 (HET) and col4a1Δ20/Δ20 (HOM) larvae exhibit a decrease in distance travelled (mm) compared to compared to col4a1+/+ (WT) siblings. D. col4a1+/Δ20 and col4a1Δ20/Δ20 larvae exhibit decreased velocity compared to col4a1+/+ siblings. E. col4a1Δ20/Δ20 larvae spent less time active than col4a1+/+ siblings. Time active is calculated as a percentage of total time spent moving during a 10-minute recording. C-E. Data were analysed with a one-way ANOVA and presented as mean, and data points represent measurements from individual larvae, col4a1+/+ n = 77, col4a1+/Δ20 n = 131, col4a1Δ20/Δ20 n = 64 from 4 independent replicates with larvae genotyped afterwards. Asterisks signify means significantly different at the 5 % level using the Tukey HSD test with * P ≤ 0.05, **P ≤ 0.01 and ns denoting no significant difference. PHENOTYPE:
|

col4a1Δ20 mutant larvae exhibit increased mmp9 and tgfbeta expression at 25dpf. A. col4a1 transcript was reduced in col4a1+/Δ20 (HET) and col4a1Δ20/Δ20 (HOM) larvae compared to col4a1+/+ (WT) siblings, measured using qRT-PCR. The same samples were used to measure expression of (B) mmp2, (C) mmp9, (D) mmp13, (E) mmp14 and (F) tgfBeta. Each data point represents individual zebrafish (minus tail) with n = 9 per genotype from 2 biological repeats. For parametric data (A, B, & E) log(RQ) values were analysed with a one-way ANOVA and presented as the mean. Asterisks signify means significantly different at the 5 % level using the Tukey HSD test. Nonparametric data (C, D & F) were analysed with the Kruskal-Wallis test and Dunn’s post-hoc test. Data are shown as the median. ns P > 0.05, * P ≤ 0.05 and **P ≤ 0.01. EXPRESSION / LABELING:
PHENOTYPE:
|
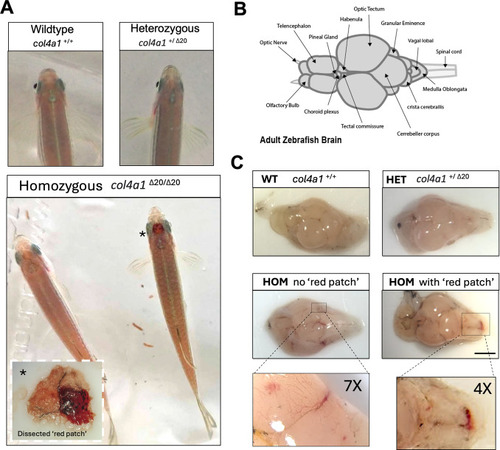
col4a1Δ20 mutant fish display spontaneous brain haemorrhages during adulthood. A. Two adult homozygous (col4a1Δ20/Δ20) zebrafish viewed dorsally with a cephalic ‘red patch’ (right, marked with an *) and one without (left) (lower panel). The dashed white outlined insert image is a representative image of a successfully dissected ‘red patch’. Above are the heads of wildtype (col4a1+/+) and heterozygous (col4a1+/Δ20) siblings. B. A diagram of the dorsal adult zebrafish brain adapted from [61] and created in Adobe Illustrator. C. Representative images of whole brains from adult sibling zebrafish at 12 months old. The top two panels are brains from col4a1+/+and col4a1+/Δ20fish and the bottom two panels are brains from col4a1Δ20/Δ20 fish with (right) and without (left) a visible ‘red patch’. The images below are magnifications of the regions indicated. The scale bar represents 1 mm. PHENOTYPE:
|