
Fig. 2
- ID
- ZDB-IMAGE-251022-20
- Genes
- Publication
- Flatman et al., 2025 - Loss of col4a1 in zebrafish recapitulates the cerebrovascular phenotypes associated with monogenic cerebral small vessel disease
- All Figures
- Figures for Flatman et al., 2025
|
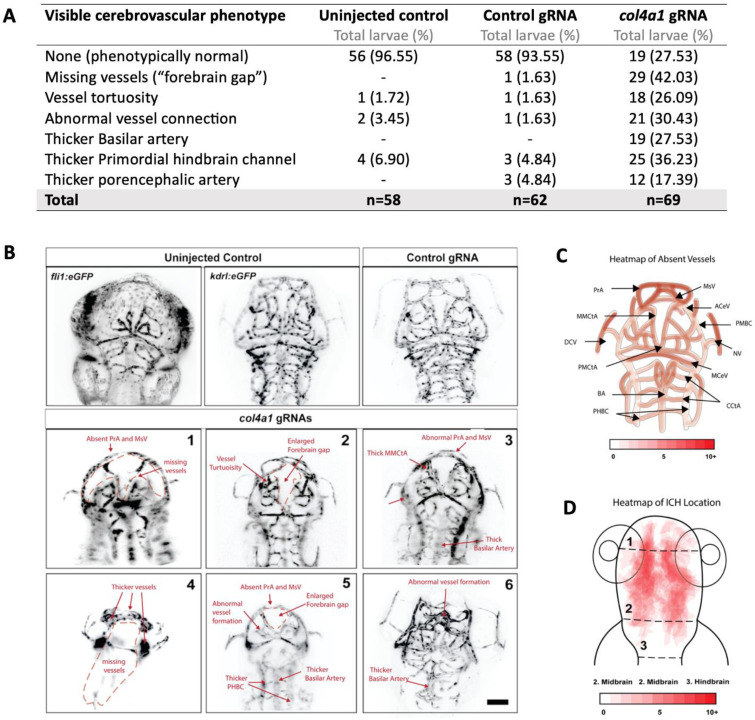
Fig. 2 col4a1 crispants display a spectrum of cerebrovascular defects at 3dpf. A. Table with the frequencies of observed cerebrovascular phenotypes in col4a1 crispant larvae at 3dpf. Visual classification of cerebrovasculature phenotypes in tg(kdrl:EGFP) larvae injected with a control gRNA, col4a1 targeting gRNA, or left uninjected, imaged in dorsal orientation using light sheet microscopy. Images from 7 biological replicates used. B. Inverted maximum intensity projections of the cerebrovasculature in larvae that have been labelled to highlight specific vessel abnormalities in 6 col4a1 crispants injected with col4a1 targeting gRNA. Scale bar is 100 µm. All images obtained on the Tg(kdrl:EGFP) background, except the top left, which is on the Tg(fli1:EGFP) background to illustrate fluorescence level differences. C. Heatmap schematic to illustrate missing vessels identified in col4a1 crispants generated on a Tg(kdrl:EGFP) background (n = 61). The intensity of red indicates the number of crispants that had that section of vessel missing, which was identified using maximum intensity projections of z-stacks from light sheet fluorescent microscopy. D. Heatmap for the location of ICH in col4a1 crispants. Haemoglobin was stained in col4a1 crispants with O-Dianisidine and imaged in a lateral orientation n = 48. The trace of each haematoma was laid on top of each other to create a heatmap in Adobe Illustrator. Dashed lines show the three main brain regions, and the scale indicates the frequency of ICH in each area.