
Fig. 4
- ID
- ZDB-IMAGE-251022-22
- Genes
- Publication
- Flatman et al., 2025 - Loss of col4a1 in zebrafish recapitulates the cerebrovascular phenotypes associated with monogenic cerebral small vessel disease
- All Figures
- Figures for Flatman et al., 2025
|
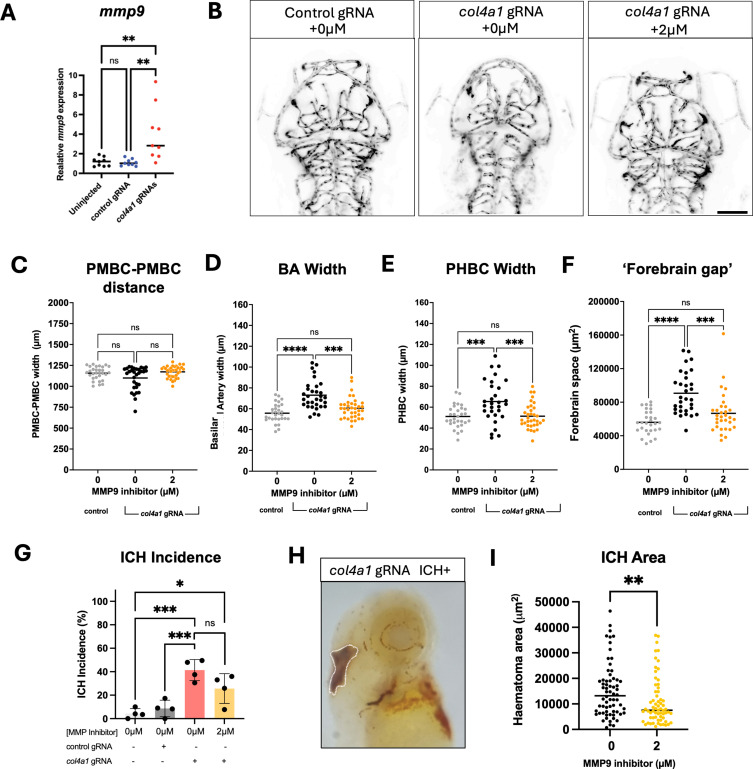
Fig. 4 Pharmacological inhibition of MMP9 rescues cerebrovascular defects and reduces haematoma expansion in col4a1 crispants. A. Relative levels of mmp9 transcript in col4a1 crispants. RNA extracted from 24 pooled whole zebrafish larvae at 3 dpf that were injected with either col4a1 targeting gRNAs or a control gRNA compared to uninjected siblings. Gene expression was calculated from RT-qPCR data using the comparative ΔΔCt method normalised to the gapdh and actin housekeepers and is relative to the uninjected control. Each data point is a biological repeat of which there were n = 9. Data were analysed with the Kruskal-Wallis test and Dunn’s post-hoc test. B. Representative inverted maximum intensity projections of the cerebrovasculature in Tg(kdrl: EGFP) col4a1 crispants treated with 0 or 2 µM MMP-9 inhibitor I (ab142180), and untreated control injected siblings. The zebrafish were live-imaged at 3 dpf using light-sheet microscopy in a dorsal orientation with a 20x objective and 0.7x digital zoom. The scale bar is 100 µm. C. The distance between both primordial midbrain channels (PMBC) vessels in µm. D. The mean width of the basilar artery (BA) measured in µm. E. The average width of the left and right primordial hindbrain channels (PHBC) measured in µm. F. The mean area in the forebrain absent of vessels measured in µm2. C-F. Data were analysed with the Kruskal-Wallis test and Dunn’s post-hoc test and presented as mean. Each data point is an individual fish (n = 30–36), results are from 3 biological replicates. Asterisks signify means that are significantly different at the 5 % level using the Tukey HSD test . G. The incidence of ICH in MMP9-inhibitor-I treated col4a1 crispants at 3 dpf compared to control injected siblings in larva stained with o-dianisidine. Data analysed with one-way ANOVA. Each value represents a pool of n = 25–50 embryos from 4 biological replicates. H. Representative image of an ICH+ col4a1 crispant stained with o-dianisidine at 3 dpf (haematoma indicated with white line). I. Haematoma area (µm2) quantification at 3 dpf in col4a1 crispants treated with 2 µM of MMP-9 inhibitor (n = 66) or without (n = 65). Data from 3 biological replicates and analysed with the Mann-Whitney T-test. For all tests ns P > 0.05, * P ≤ 0.05, **P ≤ 0.01, *** P ≤ 0.001 and **** P ≤ 0.0001.