
Fig. 1
- ID
- ZDB-IMAGE-251022-19
- Genes
- Publication
- Flatman et al., 2025 - Loss of col4a1 in zebrafish recapitulates the cerebrovascular phenotypes associated with monogenic cerebral small vessel disease
- All Figures
- Figures for Flatman et al., 2025
|
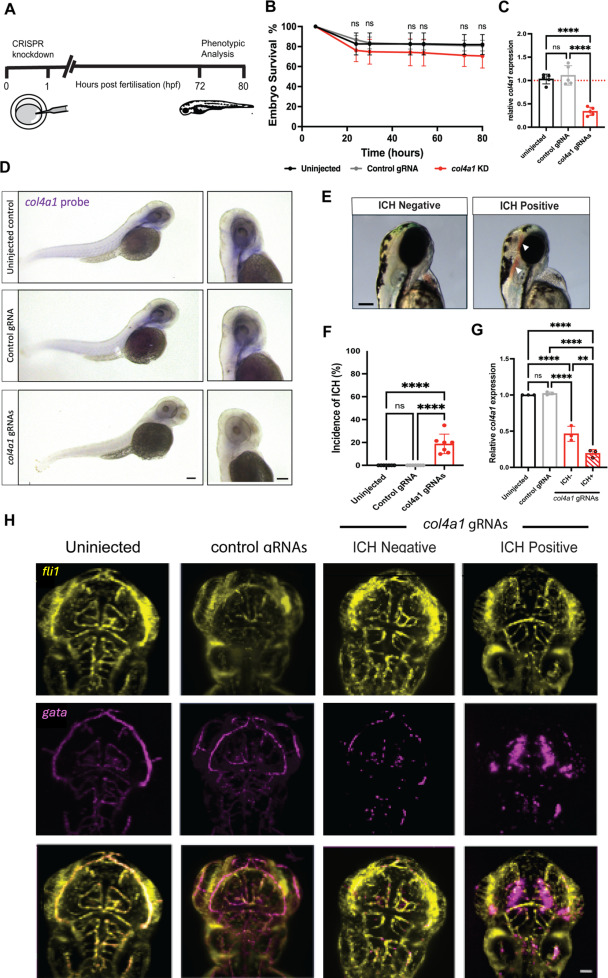
Fig. 1 col4a1 crispant zebrafish larvae exhibit spontaneous brain haemorrhages A. Schematic representation of the col4a1 crispant experimental timeline. Crispants were injected as single cell zygotes with a cocktail of four gRNAs targeting the zebrafish col4a1 gene. B. The survival of zebrafish larvae as the mean percentage alive at various time points for col4a1 crispants injected with col4a1 gRNAs (red), compared to siblings injected with a control gRNA (grey) or left uninjected (black). Measurements commenced at 6 hpf after fertilisation was confirmed. The mean percentage was calculated from four experimental repeats. C. col4a1 gene expression analysis of col4a1 crispant larvae compared to control-injected and uninjected larvae was conducted using RNA extracted from whole larvae at 3 dpf. Relative mRNA expression was quantified using pooled whole larvae (n = 24 per sample). Individual points represent each result for each biological replicate (n = 5). D. Whole-mount in situ hybridisation of fixed bleached zebrafish larvae at 3 dpf with an antisense probe (purplish-blue signal) for col4a1 mRNA throughout the entire body (left) and in the heads (right). Scale bar = 200 µm. E. Lateral view of an ICH- control zebrafish and an ICH+ (white arrows) col4a1 crispant at 3 dpf. Images were acquired with a 6.3x objective, and the scale bar represents 100 µm. F. ICH was identified using brightfield microscopy and mean incidence of spontaneous ICH at 3 dpf from 7 biological repeats are shown as individual data points. G. col4a1 expression in whole zebrafish larvae at 3 dpf injected with either col4a1 targeting or control gRNAs and cas9 relative to uninjected controls. Before RNA extraction, col4a1 crispants were split into ICH+ or the ICH- group n = 23 larvae per group, per biological replicate, with each repeat shown as an individual point. H. Maximum intensity projection images of col4a1 crispants captured using light-sheet microscopy with a 20x objective and 1x digital zoom. Transgenic zebrafish larvae with fluorescent vasculature using false colours transgenic blood Tg(gata1:dsred) shown as magenta and endothelial cell-specific Tg(fli1:EGFP) shown as yellow in a dorsal orientation at 3 dpf. Controls were uninjected or injected with a control gRNA. Scale bar = 100 µm. B-C & F-G. Data were analysed using one-way ANOVA with mean displayed and error bars indicate the standard deviation of the mean. Asterisks denote means that are significantly different at the 5 % level, as determined by the Tukey HSD test: ns P > 0.05, **P ≤ 0.01, *** P ≤ 0.001 and **** P ≤ 0.0001. C&G. Gene expression was assessed by qRT-PCR and calculated using the comparative ΔΔCt method, normalising expression to both actin and gapdh housekeeper genes with expression shown relative to uninjected mRNA expression.