
Fig. 7
|
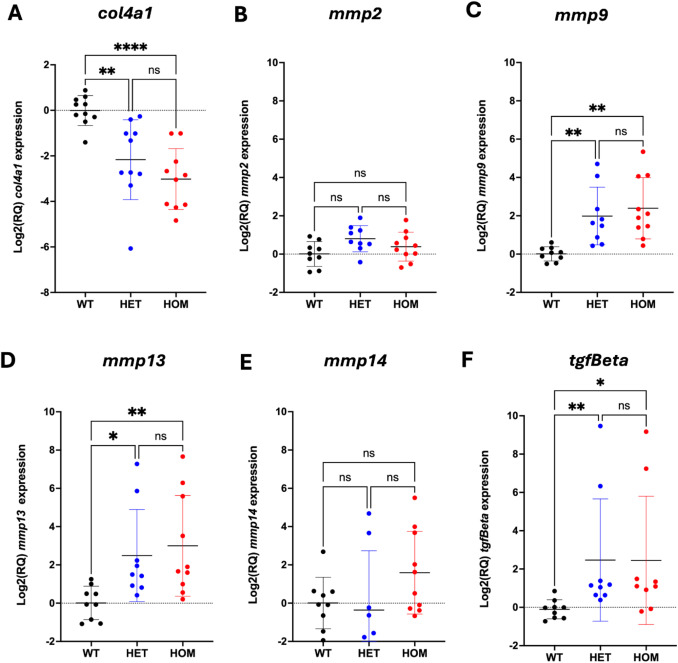
Fig. 7 col4a1Δ20 mutant larvae exhibit increased mmp9 and tgfbeta expression at 25dpf. A. col4a1 transcript was reduced in col4a1+/Δ20 (HET) and col4a1Δ20/Δ20 (HOM) larvae compared to col4a1+/+ (WT) siblings, measured using qRT-PCR. The same samples were used to measure expression of (B) mmp2, (C) mmp9, (D) mmp13, (E) mmp14 and (F) tgfBeta. Each data point represents individual zebrafish (minus tail) with n = 9 per genotype from 2 biological repeats. For parametric data (A, B, & E) log(RQ) values were analysed with a one-way ANOVA and presented as the mean. Asterisks signify means significantly different at the 5 % level using the Tukey HSD test. Nonparametric data (C, D & F) were analysed with the Kruskal-Wallis test and Dunn’s post-hoc test. Data are shown as the median. ns P > 0.05, * P ≤ 0.05 and **P ≤ 0.01.