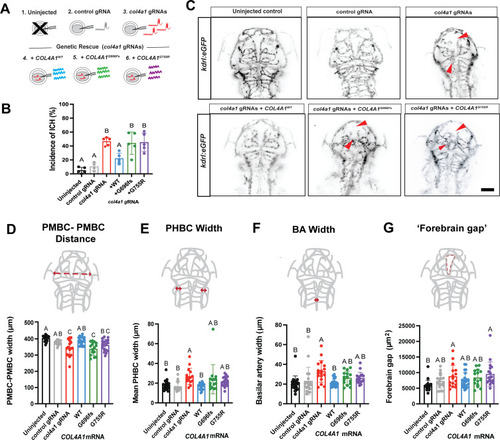
Human wild type COL4A1 mRNA can rescue certain cerebrovascular phenotypes in col4a1 crispants. A. Schematic summarising the injection groups used in mRNA rescue experiments. B. The incidence of ICH was measured as a percentage of the total larvae number. Wildtype zebrafish larvae were uninjected or microinjected with a control gRNA or 4 col4a1 targeting gRNAs to knock down col4a1 expression at the single-cell stage. col4a1 crispants were also co-injected with 30pg WT human COL4A1 mRNA or human pathogenic variants COL4A1G696fs and COL4A1G755R. Data shown is from 5 biological replicates with (n = 25–40). C. Representative images of the cerebral vasculature of Tg(kdrl:EGFP) zebrafish injected with a control gRNA or col4a1 gRNAs or left uninjected. A proportion of col4a1 crispants received an additional injection of either human WT COL4A1 mRNA or the human pathogenic variants COL4A1G696fs and COL4A1G755R. Vascular defects highlighted with a red arrow. The scale bar represents 100 µm. Larvae were dorsally orientated, and maximum intensity projections were presented from light sheet microscopy using a 20x objective and 1x digital zoom. D-G: Manual vascular measurements made of vascular parameters using maximum intensity projections Z-stacks of col4a1 crispants cerebrovasculature on the Tg(kdrl:EGFP) background. Specific measurements calculated include (D) distance between primordial midbrain channels (PMBC) (µm), (E) primordial hindbrain channel (PHBC) width (µm), (F) basilar artery (BA) width (µm) and (G) forebrain space (µm2). For each experimental group, n = 27–30 from three biological replicates, with each larval measurement plotted individually. B & D-H. Data analysed with one way ANOVA and presented as mean ± SD. Asterisks Letters A, B and C are compact letter displays to signify means that are significantly different at the 5 % level using the Tukey HSD test.
|
