
- Title
-
RNA methyltransferase SPOUT1/CENP-32 links mitotic spindle organization with the neurodevelopmental disorder SpADMiSS
- Authors
- Dharmadhikari, A.V., Abad, M.A., Khan, S., Maroofian, R., Sands, T.T., Ullah, F., Samejima, I., Shen, Y., Wear, M.A., Moore, K.E., Kondakova, E., Mitina, N., Schaub, T., Lee, G.K., Umandap, C.H., Berger, S.M., Iglesias, A.D., Popp, B., Abou Jamra, R., Gabriel, H., Rentas, S., Rippert, A.L., Gray, C., Izumi, K., Conlin, L.K., Koboldt, D.C., Mosher, T.M., Hickey, S.E., Albert, D.V.F., Norwood, H., Lewanda, A.F., Dai, H., Liu, P., Mitani, T., Marafi, D., Eker, H.K., Pehlivan, D., Posey, J.E., Lippa, N.C., Vena, N., Heinzen, E.L., Goldstein, D.B., Mignot, C., de Sainte Agathe, J.M., Al-Sannaa, N.A., Zamani, M., Sadeghian, S., Azizimalamiri, R., Seifia, T., Zaki, M.S., Abdel-Salam, G.M.H., Abdel-Hamid, M.S., Alabdi, L., Alkuraya, F.S., Dawoud, H., Lofty, A., Bauer, P., Zifarelli, G., Afzal, E., Zafar, F., Efthymiou, S., Gossett, D., Towne, M.C., Yeneabat, R., Perez-Duenas, B., Cazurro-Gutierrez, A., Verdura, E., Cantarin-Extremera, V., Marques, A.D.V., Helwak, A., Tollervey, D., Wontakal, S.N., Aggarwal, V.S., Rosenfeld, J.A., Tarabykin, V., Ohta, S., Lupski, J.R., Houlden, H., Earnshaw, W.C., Davis, E.E., Jeyaprakash, A.A., Liao, J.
- Source
- Full text @ Nat. Commun.
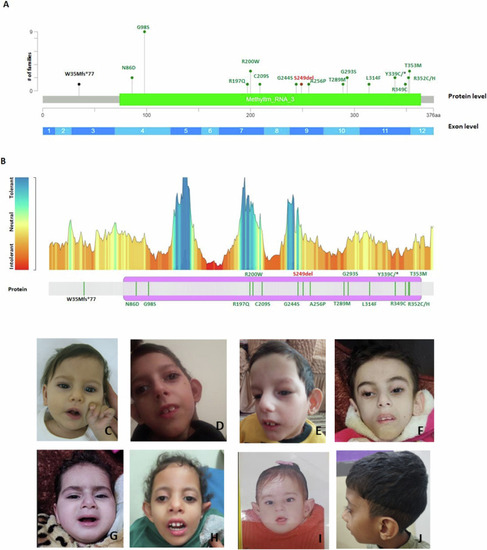
Majority of |
EXPRESSION / LABELING:
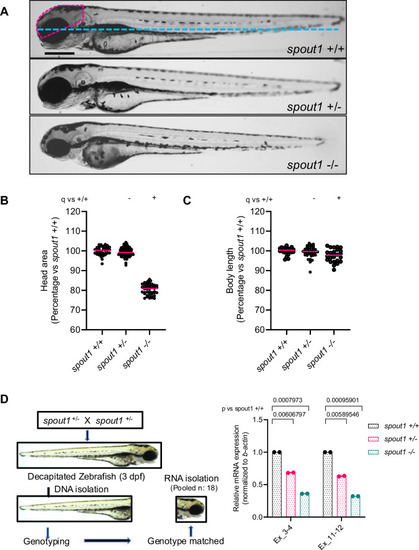
PHENOTYPE:
|
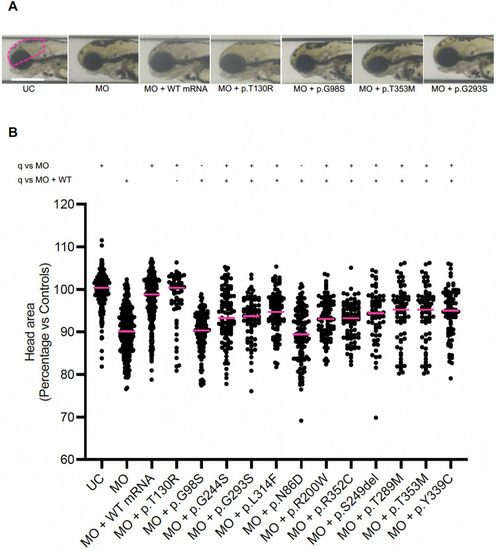
In vivo complementation assay indicates that variants identified in affected individuals are pathogenic. PHENOTYPE:
|
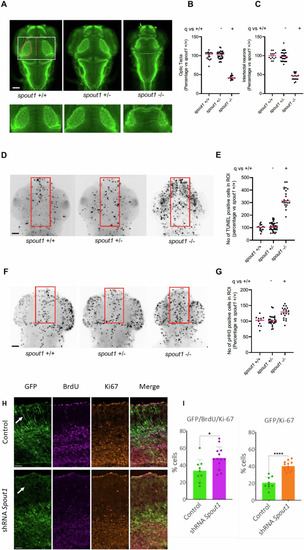
PHENOTYPE:
|
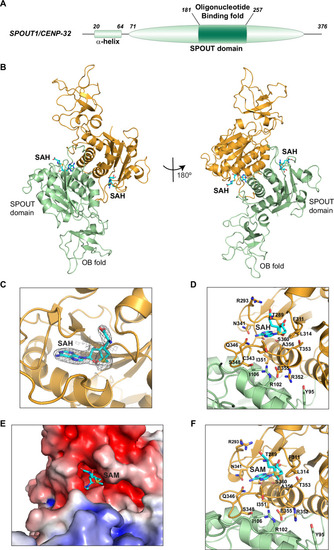
Structural characterization reveals that SPOUT1/CENP-32 is a SPOUT Methyltransferase that dimerizes through its catalytic domain. |
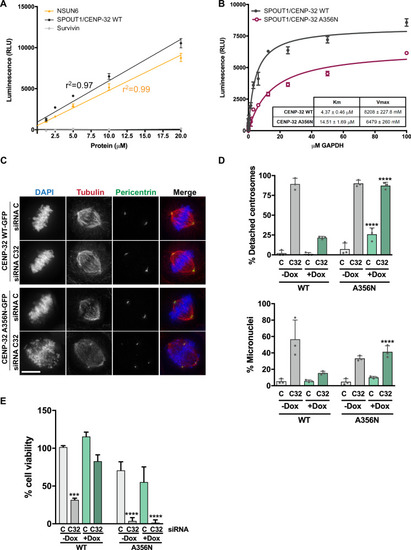
SPOUT1/CENP-32 is an active Methyltransferase and its activity is crucial for its mitotic function. |
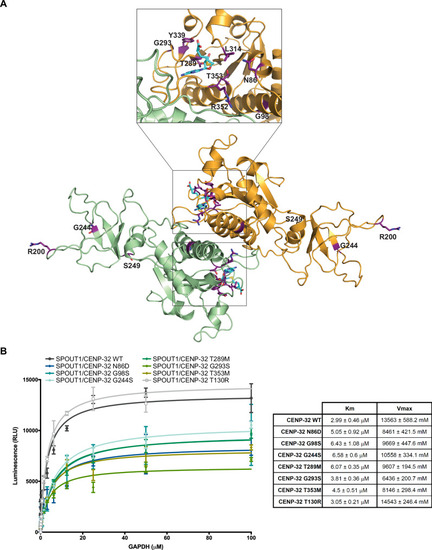
SPOUT1/CENP-32 patient variants show decreased methyltransferase activity. |
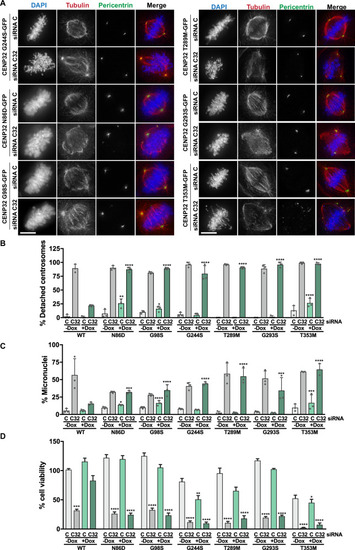
SPOUT1/CENP-32 patient variants lead to alterations of spindle organisation. |
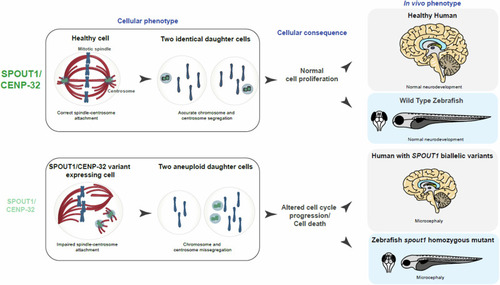
Schematic summarizing the proposed differences between healthy cells and |