
Fig. 2
- ID
- ZDB-IMAGE-250219-63
- Genes
- Publication
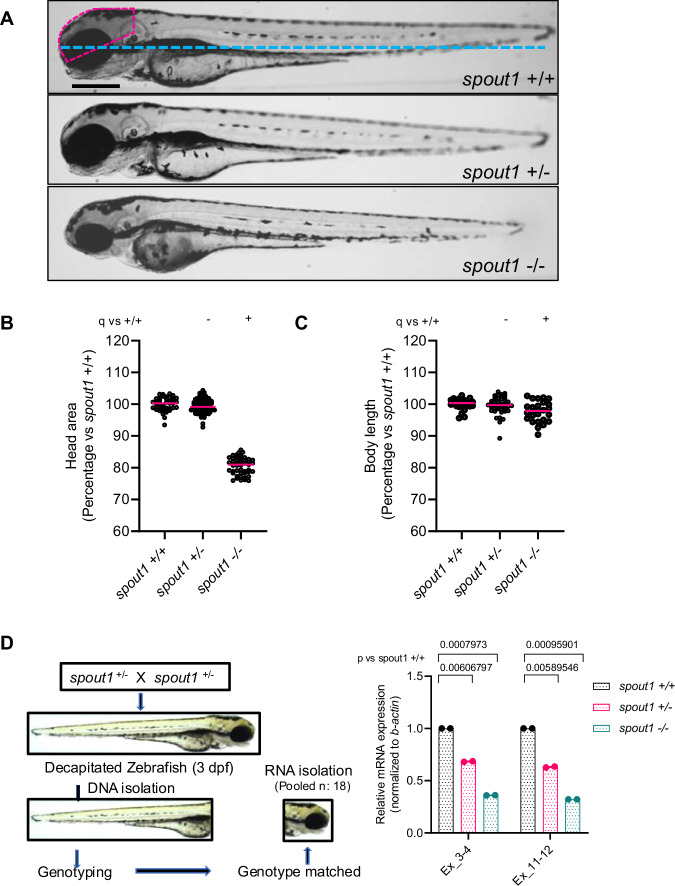
- Dharmadhikari et al., 2025 - RNA methyltransferase SPOUT1/CENP-32 links mitotic spindle organization with the neurodevelopmental disorder SpADMiSS
- All Figures
- Figures for Dharmadhikari et al., 2025
|
Fig. 2