|
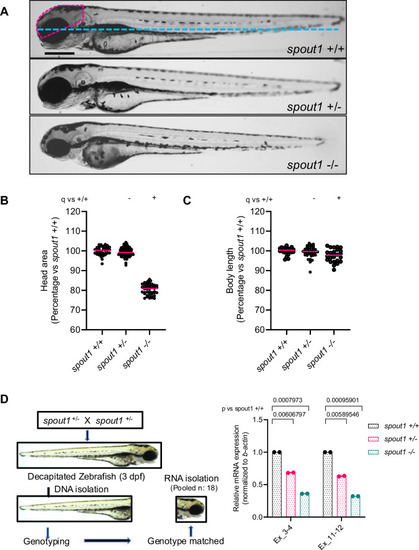
spout1/cenp-32 mutant larvae display reduced head area. A Representative bright field lateral images of spout1/cenp-32+/+, spout1/cenp-32+/- and spout1/cenp-32−/− are shown at 3 days post-fertilization (dpf); pink dashed outline depicts head size measured, and the blue dotted line shows the body length measured. B, C Quantification of lateral head size (B) and body length (C) measurements were analyzed from combined experimental batches (n = 2 biological replicates). Statistical differences were calculated using a non-parametric ANOVA with Kruskal-Wallis test followed by Dunn’s multiple comparisons test by controlling False Discovery Rate (original FDR method of Benjamini and Hochberg); ( + ) and (-) indicate significant and non-significant differences, respectively. Median values are shown with pink horizontal lines. See Supplementary Table S2 for exact adjusted q-values and numbers of larvae. D Schematic representation (left) of sample preparation for qPCR to monitor endogenous spout1/cenp-32 transcript (right); statistical differences were calculated using unpaired t-test. Two biological replicates were performed, each with technical triplicates. Scale bar, 300 µM. Source data are provided as a Source Data file.
|