
- Title
-
p65 signaling dynamics drive the developmental progression of hematopoietic stem and progenitor cells through cell cycle regulation
- Authors
- Campbell, C.A., Calderon, R., Pavani, G., Cheng, X., Barakat, R., Snella, E., Liu, F., Peng, X., Essner, J.J., Dorman, K.S., McGrail, M., Gadue, P., French, D.L., Espin-Palazon, R.
- Source
- Full text @ Nat. Commun.
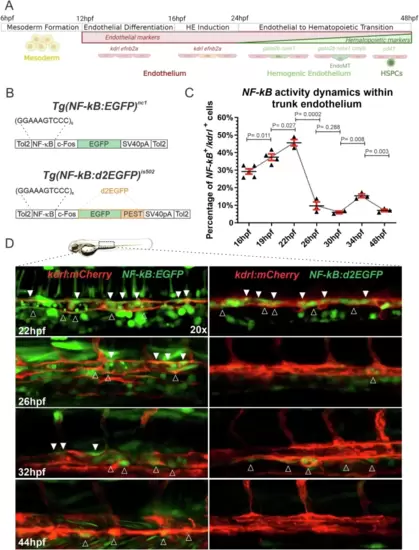
Tg(NF-kB:d2EGFP)is502 embryos reveal real-time NF-kB activation dynamics within the endothelium.A HSPC development in zebrafish embryos. Mesoderm is specified from 6hpf and endothelial precursors from 12hpf. Hemogenic endothelium (HE) can be visualized within the dorsal aorta by WISH for runx1 and gata2b, and subsequently cmyb, from 22-48hpf. Emergent HSPCs can be labeled within the floor of the dorsal aorta from 48hpf with the reporter Tg(cd41:eGFP). B Schematic diagrams of constructs used to generate Tg(NF-kB:EGFP)nc1 (top)45 and Tg(NF-kB:d2EGFP)is502 (bottom) (this work). C Flow cytometric quantification of NF-kB:d2EGFP+; kdrl:mCherry+ cells within surgically isolated embryonic trunks at 16, 19, 22, 26, 30, 34, and 48hpf. Each dot represents 20–25 pooled embryonic trunks. Black horizontal lines indicate mean ± SD (red). 16hpf (n = 5), 19hpf (n = 4), 22hpf (n = 3), 26hpf (n = 3), 30hpf (n = 2), 34hpf (n = 3), and 48hpf (n = 3). Statistics were generated using an unpaired two-tailed T-test. Source data are provided as a Source Data file. D Representative 20x maximum projection confocal images of the trunk region of live NF-kB:EGFP+; kdrl:mCherry+ (left panels), and NF-kB:d2EGFP+; kdrl:mCherry+ (right panels) embryos imaged at 22, 26, 32, and 44hpf. Outlined and solid white arrowheads indicate NF-kB activity within the ventral side or roof, respectively, of the developing vascular cord. Each timepoint was repeated three times independently with similar results. Figure 1A created with BioRender.com released under a Creative Commons Attribution-NonCommercial-NoDerivs 4.0 International license. |
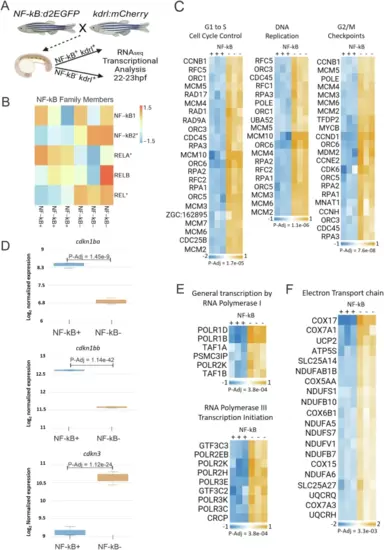
Transcriptomic analysis of NF-kB+ ECs showed upregulated p65 and downregulated cell cycle-specific genes.A Schematic of the experimental design followed in Fig. 2. kdrl:mCherry zebrafish were mated to NF-kB:d2EGFP to generate double transgenic kdrl:mCherry+, NF-kB:d2EGFP+ embryos for subsequent bulk transcriptomic profiling of FACS purified ECs (B–F). B Heat map depicting transcript levels of NF-kB family members in NF-kB+ versus NF-kB- kdrl+ ECs. (*) are statistically significant at <1% FDR. C Heat map depicting differentially expressed genes involved in G1 to S cell cycle control (left), DNA replication (middle), and G2/M checkpoints in NF-kB+ versus NF-kB- kdrl+ ECs. D Box plots depicting differentially expressed cyclin-dependent kinase inhibitors in NF-kB+ and NF-kB- kdrl+ ECs. Data were generated from three biological replicates. cdkn1ba (for NF-kB + : Max = 8.4, Min = 8.2, Median = 8.4, Q1 = 8.2, Q3 = 0.0, for NF-kB-: Max = 7, Min = 6.7, Median = 6.8, Q1 = 6.7, Q3 = 7.0). cdkn1bb (for NF-kB + : Max = 12.6, Min = 12.6, Median = 12.6, Q1 = 0.0, Q3 = 0.0, for NF-kB-: Max = 11.6, Min = 11.6, Median = 11.6, Q1 = 0.0, Q3 = 0.0). cdkn3 (for NF-kB + : Max = 9.3, Min = 9.0, Median = 9.1, Q1 = 9.0, Q3 = 9.3, for NF-kB-: Max = 10.8, Min = 10.4, Median = 10.7, Q1 = 0.0, Q3 = 0.0). E Heat map showing differentially expressed genes involved in “general transcription by RNA polymerase I” (top) and “RNA polymerase III transcription initiation” (bottom) in NF-kB+ versus NF-kB- kdrl+ ECs. F Heat map depicting differentially expressed genes involved in the electron transport chain in NF-kB+ versus NF-kB- kdrl+ ECs. For the heatmaps in (C, E, F), all genes depicted are statistically significant at FDR-adjusted p values at or below the values listed. DESeq2 was used to calculate fold changes and p values and perform optional covariate correction (C–F). Figure 2A created with BioRender.com released under a Creative Commons Attribution-NonCommercial-NoDerivs 4.0 International license. |

p65 drives hemogenic endothelium patterning during HSPC development.A Representative 20x maximum projection confocal images from 24 hpf NFkB:d2mRFP+; runx1P2:Citrine+ embryos showing that all runx1+ cells are NF-kB+ in the floor of the DA. The experiment was repeated three times independently with similar results. B, C Representative histograms depicting flow cytometric analysis of 5–10 pooled 22hpf trunks isolated from NF-kB:d2EGFP+; kdrl:mCherry+ embryos injected with p65 gRNA only (blue) or p65 gRNA + Cas9 (red). NF-kB+/kdrl+ EC population (B), NF-kB+/kdrl- non-EC population (C) (normalized to mode). D Representative 20x maximum projection confocal images from F0 52hpf cd41:eGFP+; kdrl:mCherry+ injected with p65 gRNA only (control), or p65 gRNA + Cas9 (left panel), and quantifications by flow cytometric analysis of 5–10 pooled embryos (right). p65 gRNA only (n = 3) and p65 gRNA + Cas9 (n = 6). E, G Representative bright-field images (top panels) of p65+/+, p65STOP/+, and p65STOP/STOP embryos at the indicated stages subjected to WISH for the HE markers gata2b, runx1, and cmyb, followed by genotyping, and their quantifications (bottom panels). Each dot represents an individual embryo. Black arrowheads denote HECs on the floor of DA. Scale bar = 100 µm. Black horizontal lines indicate mean ± SD (Black). Data were analyzed by unpaired two-tailed T-test (B–D) or ordinary one-way ANOVA with Turkey’s multiple comparisons test (E–G). Source data are provided as a Source Data file. |
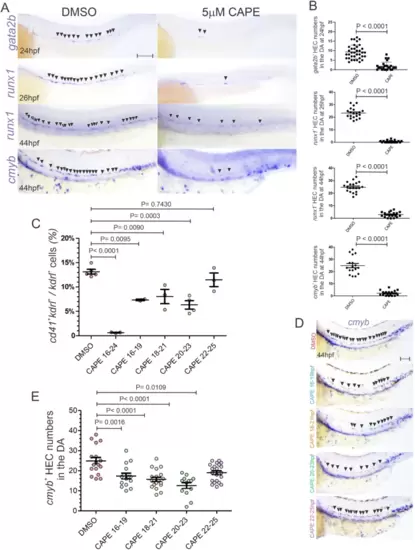
The first wave of p65 activity is essential for the specification of the HE.A WISH for the HEC markers gata2b, runx1, and cmyb at the indicated stages in AB embryos treated with DMSO (left panels) or 5 µM CAPE (right panels) from 16–24hpf. Black arrowheads denote HECs in floor of DA. Scale bar = 100 µM. B Quantification of gata2b+, runx1+, and cmyb+ cells from (A). Each dot represents the number of HECs per embryo. C Percentage of cd41+, kdrl+ cells within the total kdrl+ EC fraction at 52hpf assessed by flow cytometry from cd41:eGFP; kdrl:mCherry embryonic trunks treated with DMSO or 5 µM CAPE from 16–19hpf, 18–21, 20–23hpf, 22–25hpf, and 16–24hpf. Each dot represents 10–15 surgically isolated embryonic trunks from cd41:eGFP+; kdrl:mCherry+ embryos. DMSO (n = 5), 5 µM CAPE from 16–19hpf (n = 2), 18–21hpf (n = 3), 20–23hpf (n = 4), 22–25hpf (n = 3), and 16–24hpf (n = 3). D Representative bright-field images of WISH for the HEC marker cmyb in 44hpf AB embryos treated with DMSO (red) or 5 µM CAPE-treated embryos from 16–19hpf (blue), 18– 21 (orange), 20–23hpf (green), and 22–25hpf (violet). Black arrowheads denote HECs in floor of DA. Scale bar = 100 µM. E Quantification of cmyb+ cells from (D). Each dot represents the number of cmyb+ HECs per embryo. Black horizontal lines indicate mean ± SD. Data were analyzed by unpaired two-tailed T-test (B) or ordinary one-way ANOVA with Turkey’s multiple comparisons test (C, E). Source data are provided as a Source Data file. |

P65 drives EC quiescence prior to endothelial to hematopoietic transition.A Representative histograms of live kdrl:mCherry+; NF-kB:d2EGFP− (left) and kdrl:mCherry+; NF-kB:d2EGFP+ cells (right) from 15–20 pooled 22hpf isolated trunks stained with DNA Vibrant DyeCycle Ruby. Brackets denote resting/Gap 1 phase (G0-G1), Synthesis phase (S), and Gap 2/Mitotic phase (G2-M). B Quantification from (A). Each dot represents 15–20 pooled embryonic trunks, n = 6. Black horizontal lines indicate mean ± SD. C Representative confocal maximum projection image of the DA of a 22hpf NF-kB:d2EGFP+; kdrl:mCherry+ embryo subjected to WIHC for pH3 (magenta), NF-kB activation (green), and the endothelial marker kdrl (red). The dashed circle indicates a mitotic pH3+ cell. Notice that mitotic kdrl+ ECs have inactive NF-kB (NF-kB−). The experiment was repeated three times independently with similar results. D Quantification of the percentage of pH3+ cells from (E, E”, F, F”). Each dot represents 15–20 pooled embryonic trunks, n = 3. Black horizontal lines indicate mean ± SD. (E, F”’) Representative histograms depicting flow cytometric analysis of 22hpf DMSO (E, E”’), or 2 µM CAPE-treated (F, F”’), dissociated NF-kB:d2EGFP+; kdrl:mCherry+ embryonic trunks subjected to intracellular flow for d2EGFP, mCherry (blue), and pH3 (red). Chemical treatments were applied from 16hpf. E, F All kdrl:mCherry+ cells. E’, F’ kdrl:mCherry+; NF-kB:d2EGFP− cells. E”, F” kdrl:mCherry+; NF-kB:d2EGFP+ cells. E”’, F”’ Representative contour plot of kdrl:mCherry+; NF-kB:d2EGFP+ cells from (E”). The dotted line separates pH3− (left) from pH3+ (right) cells. Data were analyzed by ordinary one-way ANOVA with Turkey’s multiple comparisons test (B, D). Source data are provided as a Source Data file. |

In vivo NF-kB signaling dynamics at the single cell resolution.A Illustration depicting the experimental design in (B). Briefly, NFkB:Kaede+; fli:nEGFP+ embryos were photoconverted at 25hpf with UV light for 10 min and subsequently subjected to confocal microscopy in the DA at 34hpf. B Representative maximum projection confocal images of the DA of 34hpf NFkB:Kaede+; fli:nEGFP+ embryos. Yellow (Kaede green+; Kaede red+) cytoplasms are cells with both NF-kB activity waves occurring within the same cell (cells outlined in yellow). Dashed red delineates EC with Kaede (red+, green-) cytoplasm. The experiment was repeated three times independently with similar results. Figure 6A created with BioRender.com released under a Creative Commons Attribution-NonCommercial-NoDerivs 4.0 International license. |
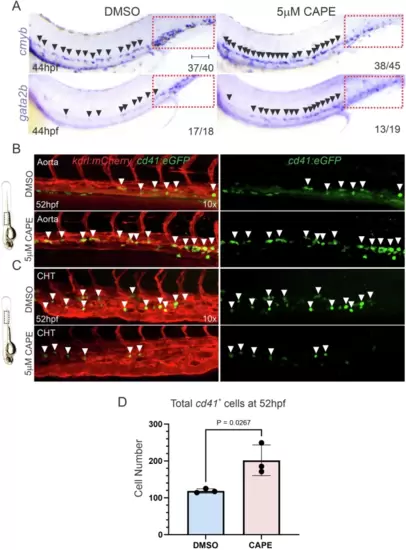
Prolonged NF-kB resolution phase enhances the proliferative capabilities of nascent HSPCs.A WISH for the HE markers cmyb and gata2b in 44hpf AB embryos treated with DMSO (left), or 5 µM CAPE (right) from 28hpf. Red dashed boxes indicate the CHT region. Numbers in panels represent larvae with indicated phenotype. The experiment was repeated three times independently with similar results. B, C Representative confocal maximum projections of the DA (B), or CHT (C), from 52hpf cd41:eGFP+; kdrl:mCherry+ embryos incubated with DMSO or 5 µM CAPE from 28hpf. White arrowheads indicate cd41+ cells. Experiments were repeated three times independently with similar results. D Flow cytometric quantifications of total cd41+ HSPCs from pooled 52hpf cd41:eGFP+ embryos incubated with DMSO or 5 µM CAPE from 28hpf. Each dot represents the total cd41+ numbers within four pooled embryos. Black horizontal lines indicate mean ± SD. Data were analyzed using an unpaired two-tailed T-test. Source data are provided as a Source Data file. |
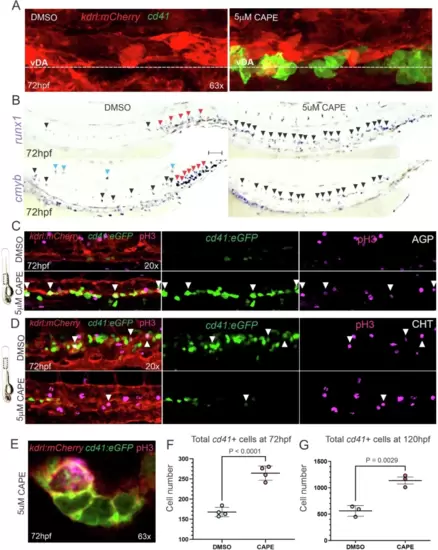
Proliferative HSPC clusters in vivo by prolongation of the pro-inflammatory resolution phase.A Representative confocal maximum projections of the DA from 72hpf cd41:eGFP+; kdrl:mCherry+ embryos incubated with DMSO (left) or 5 µM CAPE (right) from 28hpf. The experiment was repeated four times independently with similar results. B WISH for the HE markers runx1 (top) and cmyb (bottom) in 72hpf WT embryos treated with DMSO (left column) or 5 µM CAPE (right column) from 28hpf. Black, red, and blue arrowheads denote HSPCs in floor of DA, CHT, and within the circulation, respectively. Scale bar = 100 µM. The experiment was repeated three times independently with similar results. C, D Representative confocal maximum projections of the DA (C), or the CHT (D) from 72hpf cd41:eGFP+; kdrl:mCherry+ embryos treated with DMSO (top) or 5 µM CAPE (bottom) from 28hpf and stained for pH3. White arrowheads indicate cd41+/pH3+ cells. Experiments were repeated three times independently with similar results. E Representative confocal maximum projection of a cd41+/pH3+ cell within a cd41+ cluster in the DA of a 72hpf cd41:eGFP+; kdrl:mCherry+ embryos treated with 5 µM CAPE from 28hpf. The experiment was repeated four times independently with similar results. F Flow cytometry quantification of HSPC (cd41+) numbers in pooled 72hpf cd41:eGFP+; kdrl:mCherry+ embryos incubated with DMSO (blue) and 5 µM CAPE (red) from 28hpf. Each dot represents four pooled embryos. Black horizontal lines indicate mean ± SD. G Flow cytometry quantification of HSPC (cd41Low) numbers in 120hpf cd41:eGFP+; kdrl:mCherry+ embryos incubated with DMSO (blue) and 5 µM CAPE (red) from 28–72hpf. Each dot represents four pooled embryos. Black horizontal lines indicate mean ± SD. Data were analyzed using an unpaired two-tailed T-test (F, G). Source data are provided as a Source Data file. |
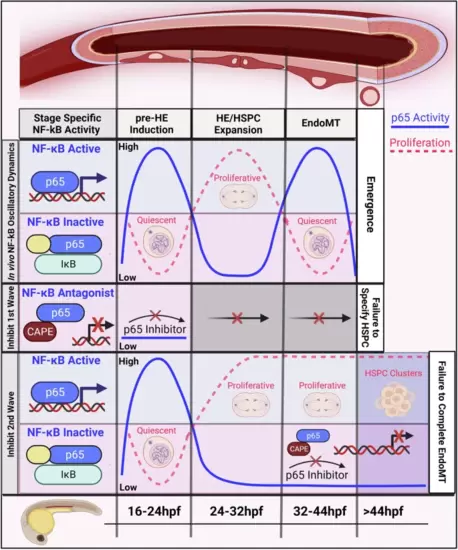
Summary model of the temporal NF-kB (p65) regulation of HSPC development and cell cycle.NF-kB activates within ECs to induce ECs to become hemogenic by restricting proliferation. NF-kB is subsequently inactivated, allowing for a proliferative expansion of the HE. Finally, NF-kB is re-activated in HECs to drive EndoMT. When the first NF-kB activity wave is disrupted, HE fails to specify. In contrast, disruption of the second wave of NF-kB activity leads to continued proliferation of the HE pool, preventing their delamination from the DA. Figure 9 created with BioRender.com released under a Creative Commons Attribution-NonCommercial-NoDerivs 4.0 International license. |