
Fig. 2
- ID
- ZDB-FIG-240909-12
- Publication
- Campbell et al., 2024 - p65 signaling dynamics drive the developmental progression of hematopoietic stem and progenitor cells through cell cycle regulation
- Other Figures
- All Figure Page
- Back to All Figure Page
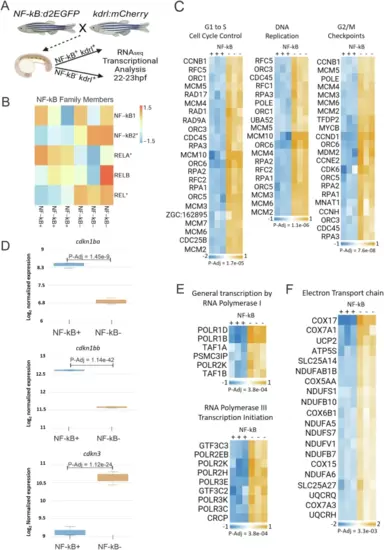
Transcriptomic analysis of NF-kB+ ECs showed upregulated p65 and downregulated cell cycle-specific genes.A Schematic of the experimental design followed in Fig. 2. kdrl:mCherry zebrafish were mated to NF-kB:d2EGFP to generate double transgenic kdrl:mCherry+, NF-kB:d2EGFP+ embryos for subsequent bulk transcriptomic profiling of FACS purified ECs (B–F). B Heat map depicting transcript levels of NF-kB family members in NF-kB+ versus NF-kB- kdrl+ ECs. (*) are statistically significant at <1% FDR. C Heat map depicting differentially expressed genes involved in G1 to S cell cycle control (left), DNA replication (middle), and G2/M checkpoints in NF-kB+ versus NF-kB- kdrl+ ECs. D Box plots depicting differentially expressed cyclin-dependent kinase inhibitors in NF-kB+ and NF-kB- kdrl+ ECs. Data were generated from three biological replicates. cdkn1ba (for NF-kB + : Max = 8.4, Min = 8.2, Median = 8.4, Q1 = 8.2, Q3 = 0.0, for NF-kB-: Max = 7, Min = 6.7, Median = 6.8, Q1 = 6.7, Q3 = 7.0). cdkn1bb (for NF-kB + : Max = 12.6, Min = 12.6, Median = 12.6, Q1 = 0.0, Q3 = 0.0, for NF-kB-: Max = 11.6, Min = 11.6, Median = 11.6, Q1 = 0.0, Q3 = 0.0). cdkn3 (for NF-kB + : Max = 9.3, Min = 9.0, Median = 9.1, Q1 = 9.0, Q3 = 9.3, for NF-kB-: Max = 10.8, Min = 10.4, Median = 10.7, Q1 = 0.0, Q3 = 0.0). E Heat map showing differentially expressed genes involved in “general transcription by RNA polymerase I” (top) and “RNA polymerase III transcription initiation” (bottom) in NF-kB+ versus NF-kB- kdrl+ ECs. F Heat map depicting differentially expressed genes involved in the electron transport chain in NF-kB+ versus NF-kB- kdrl+ ECs. For the heatmaps in (C, E, F), all genes depicted are statistically significant at FDR-adjusted p values at or below the values listed. DESeq2 was used to calculate fold changes and p values and perform optional covariate correction (C–F). Figure 2A created with BioRender.com released under a Creative Commons Attribution-NonCommercial-NoDerivs 4.0 International license. |