
Fig. 1
- ID
- ZDB-FIG-240909-11
- Publication
- Campbell et al., 2024 - p65 signaling dynamics drive the developmental progression of hematopoietic stem and progenitor cells through cell cycle regulation
- Other Figures
- All Figure Page
- Back to All Figure Page
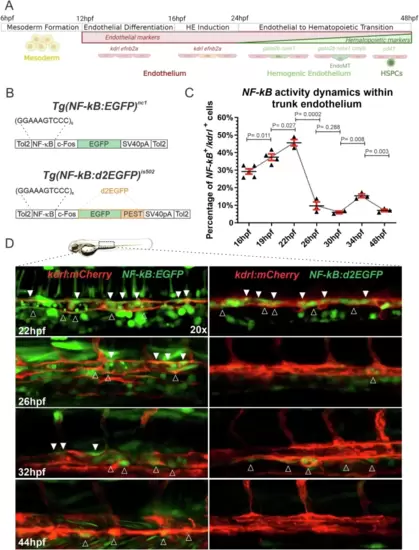
Tg(NF-kB:d2EGFP)is502 embryos reveal real-time NF-kB activation dynamics within the endothelium.A HSPC development in zebrafish embryos. Mesoderm is specified from 6hpf and endothelial precursors from 12hpf. Hemogenic endothelium (HE) can be visualized within the dorsal aorta by WISH for runx1 and gata2b, and subsequently cmyb, from 22-48hpf. Emergent HSPCs can be labeled within the floor of the dorsal aorta from 48hpf with the reporter Tg(cd41:eGFP). B Schematic diagrams of constructs used to generate Tg(NF-kB:EGFP)nc1 (top)45 and Tg(NF-kB:d2EGFP)is502 (bottom) (this work). C Flow cytometric quantification of NF-kB:d2EGFP+; kdrl:mCherry+ cells within surgically isolated embryonic trunks at 16, 19, 22, 26, 30, 34, and 48hpf. Each dot represents 20–25 pooled embryonic trunks. Black horizontal lines indicate mean ± SD (red). 16hpf (n = 5), 19hpf (n = 4), 22hpf (n = 3), 26hpf (n = 3), 30hpf (n = 2), 34hpf (n = 3), and 48hpf (n = 3). Statistics were generated using an unpaired two-tailed T-test. Source data are provided as a Source Data file. D Representative 20x maximum projection confocal images of the trunk region of live NF-kB:EGFP+; kdrl:mCherry+ (left panels), and NF-kB:d2EGFP+; kdrl:mCherry+ (right panels) embryos imaged at 22, 26, 32, and 44hpf. Outlined and solid white arrowheads indicate NF-kB activity within the ventral side or roof, respectively, of the developing vascular cord. Each timepoint was repeated three times independently with similar results. Figure 1A created with BioRender.com released under a Creative Commons Attribution-NonCommercial-NoDerivs 4.0 International license. |