
Fig. 3
- ID
- ZDB-IMAGE-240909-13
- Publication
- Campbell et al., 2024 - p65 signaling dynamics drive the developmental progression of hematopoietic stem and progenitor cells through cell cycle regulation
- All Figures
- Figures for Campbell et al., 2024
|
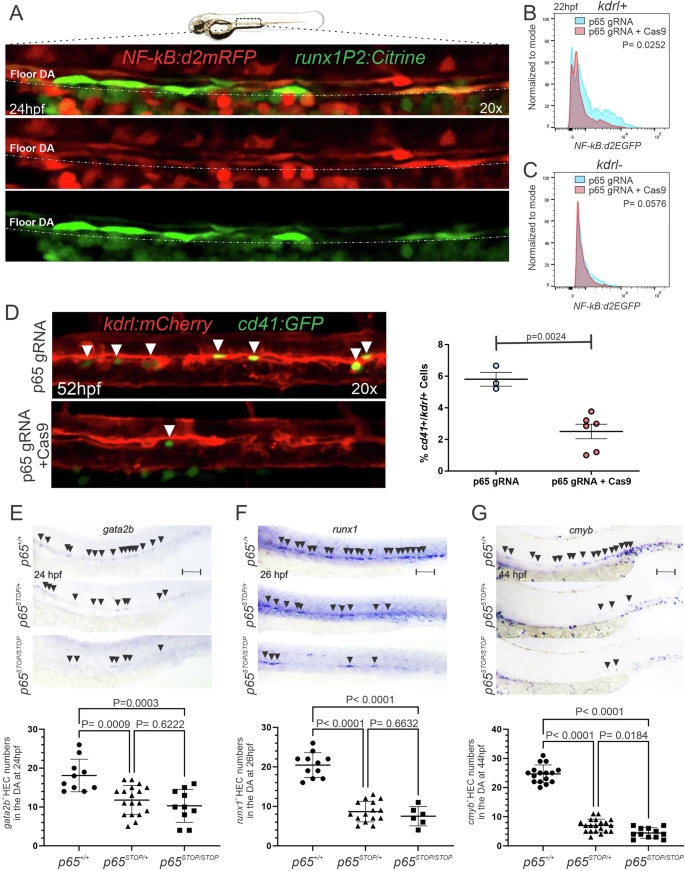
Fig. 3 p65 drives hemogenic endothelium patterning during HSPC development.A Representative 20x maximum projection confocal images from 24 hpf NFkB:d2mRFP+; runx1P2:Citrine+ embryos showing that all runx1+ cells are NF-kB+ in the floor of the DA. The experiment was repeated three times independently with similar results. B, C Representative histograms depicting flow cytometric analysis of 5–10 pooled 22hpf trunks isolated from NF-kB:d2EGFP+; kdrl:mCherry+ embryos injected with p65 gRNA only (blue) or p65 gRNA + Cas9 (red). NF-kB+/kdrl+ EC population (B), NF-kB+/kdrl- non-EC population (C) (normalized to mode). D Representative 20x maximum projection confocal images from F0 52hpf cd41:eGFP+; kdrl:mCherry+ injected with p65 gRNA only (control), or p65 gRNA + Cas9 (left panel), and quantifications by flow cytometric analysis of 5–10 pooled embryos (right). p65 gRNA only (n = 3) and p65 gRNA + Cas9 (n = 6). E, G Representative bright-field images (top panels) of p65+/+, p65STOP/+, and p65STOP/STOP embryos at the indicated stages subjected to WISH for the HE markers gata2b, runx1, and cmyb, followed by genotyping, and their quantifications (bottom panels). Each dot represents an individual embryo. Black arrowheads denote HECs on the floor of DA. Scale bar = 100 µm. Black horizontal lines indicate mean ± SD (Black). Data were analyzed by unpaired two-tailed T-test (B–D) or ordinary one-way ANOVA with Turkey’s multiple comparisons test (E–G). Source data are provided as a Source Data file.