
Fig. 4
- ID
- ZDB-IMAGE-240909-14
- Publication
- Campbell et al., 2024 - p65 signaling dynamics drive the developmental progression of hematopoietic stem and progenitor cells through cell cycle regulation
- All Figures
- Figures for Campbell et al., 2024
|
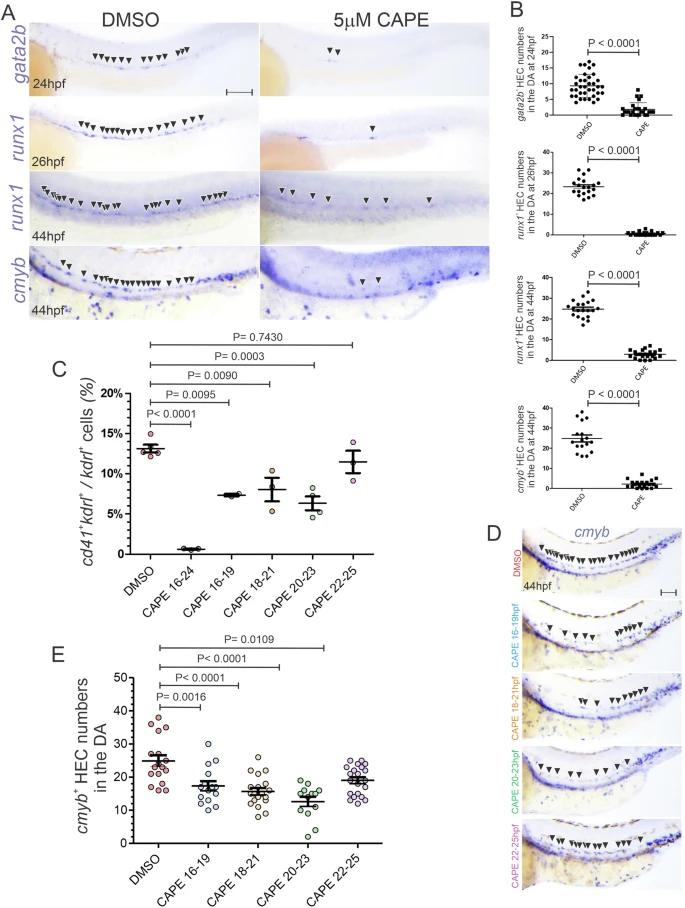
Fig. 4 The first wave of p65 activity is essential for the specification of the HE.A WISH for the HEC markers gata2b, runx1, and cmyb at the indicated stages in AB embryos treated with DMSO (left panels) or 5 µM CAPE (right panels) from 16–24hpf. Black arrowheads denote HECs in floor of DA. Scale bar = 100 µM. B Quantification of gata2b+, runx1+, and cmyb+ cells from (A). Each dot represents the number of HECs per embryo. C Percentage of cd41+, kdrl+ cells within the total kdrl+ EC fraction at 52hpf assessed by flow cytometry from cd41:eGFP; kdrl:mCherry embryonic trunks treated with DMSO or 5 µM CAPE from 16–19hpf, 18–21, 20–23hpf, 22–25hpf, and 16–24hpf. Each dot represents 10–15 surgically isolated embryonic trunks from cd41:eGFP+; kdrl:mCherry+ embryos. DMSO (n = 5), 5 µM CAPE from 16–19hpf (n = 2), 18–21hpf (n = 3), 20–23hpf (n = 4), 22–25hpf (n = 3), and 16–24hpf (n = 3). D Representative bright-field images of WISH for the HEC marker cmyb in 44hpf AB embryos treated with DMSO (red) or 5 µM CAPE-treated embryos from 16–19hpf (blue), 18– 21 (orange), 20–23hpf (green), and 22–25hpf (violet). Black arrowheads denote HECs in floor of DA. Scale bar = 100 µM. E Quantification of cmyb+ cells from (D). Each dot represents the number of cmyb+ HECs per embryo. Black horizontal lines indicate mean ± SD. Data were analyzed by unpaired two-tailed T-test (B) or ordinary one-way ANOVA with Turkey’s multiple comparisons test (C, E). Source data are provided as a Source Data file.