
Fig. 8
- ID
- ZDB-FIG-240909-18
- Publication
- Campbell et al., 2024 - p65 signaling dynamics drive the developmental progression of hematopoietic stem and progenitor cells through cell cycle regulation
- Other Figures
- All Figure Page
- Back to All Figure Page
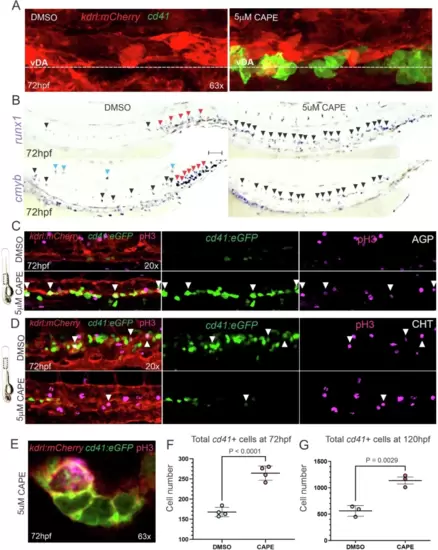
Proliferative HSPC clusters in vivo by prolongation of the pro-inflammatory resolution phase.A Representative confocal maximum projections of the DA from 72hpf cd41:eGFP+; kdrl:mCherry+ embryos incubated with DMSO (left) or 5 µM CAPE (right) from 28hpf. The experiment was repeated four times independently with similar results. B WISH for the HE markers runx1 (top) and cmyb (bottom) in 72hpf WT embryos treated with DMSO (left column) or 5 µM CAPE (right column) from 28hpf. Black, red, and blue arrowheads denote HSPCs in floor of DA, CHT, and within the circulation, respectively. Scale bar = 100 µM. The experiment was repeated three times independently with similar results. C, D Representative confocal maximum projections of the DA (C), or the CHT (D) from 72hpf cd41:eGFP+; kdrl:mCherry+ embryos treated with DMSO (top) or 5 µM CAPE (bottom) from 28hpf and stained for pH3. White arrowheads indicate cd41+/pH3+ cells. Experiments were repeated three times independently with similar results. E Representative confocal maximum projection of a cd41+/pH3+ cell within a cd41+ cluster in the DA of a 72hpf cd41:eGFP+; kdrl:mCherry+ embryos treated with 5 µM CAPE from 28hpf. The experiment was repeated four times independently with similar results. F Flow cytometry quantification of HSPC (cd41+) numbers in pooled 72hpf cd41:eGFP+; kdrl:mCherry+ embryos incubated with DMSO (blue) and 5 µM CAPE (red) from 28hpf. Each dot represents four pooled embryos. Black horizontal lines indicate mean ± SD. G Flow cytometry quantification of HSPC (cd41Low) numbers in 120hpf cd41:eGFP+; kdrl:mCherry+ embryos incubated with DMSO (blue) and 5 µM CAPE (red) from 28–72hpf. Each dot represents four pooled embryos. Black horizontal lines indicate mean ± SD. Data were analyzed using an unpaired two-tailed T-test (F, G). Source data are provided as a Source Data file. |