
- Title
-
Cdon is essential for organ left-right patterning by regulating dorsal forerunner cells clustering and Kupffer's vesicle morphogenesis
- Authors
- Deng, Z., Ran, Q., Chang, W., Li, C., Li, B., Huang, S., Huang, J., Zhang, K., Li, Y., Liu, X., Liang, Y., Guo, Z., Huang, S.
- Source
- Full text @ Front Cell Dev Biol
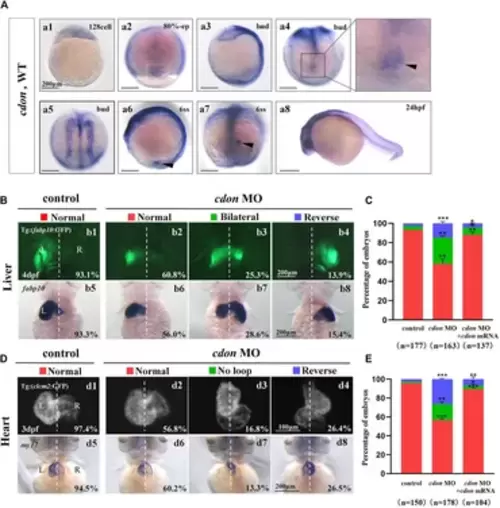
Organ left-right patterning defects in embryos injected with cdon MO at the 4-cell stage (A) The expression of cdon was examined using whole mount in situ hybridization from 128-cell stage to 24hpf. Cdon was expressed at 128-cell stage (Aa1). White arrowhead showed the expression of cdon in DFCs at 80% epiboly stage (Aa2). Black arrowhead showed the expression of cdon in DFCs at bud stage (Aa3-a4). Cdon was also expressed in midline and presumptive neural crest (Aa5). Black arrow head showed the expression of cdon in epithelial cell in KV at 6ss (Aa6-a7). Expression of cdon was examined at 24 hpf (Aa8). (B) Embryos injected with cdon MO displayed liver LR defects. b1, normal liver in Tg (fabp10:GFP) transgenic controls (93.1%, n = 102); b2, normal liver in embryos injected with cdon MO (60.8%, n = 79); b3, liver bifida in embryos injected with cdon MO (25.3%, n = 79); b4, reversed liver in embryos injected with cdon MO (13.9%, n = 79). b5, normal liver in wild type controls (93.3%, n = 75); b6-b8, embryos injected with cdon MO were examined at 4dpf using in situ experiments (n = 84). (C) Percentages of normal liver, liver bifida, and reversed liver in embryos used as control, embryos injected with cdon MO and embryos co-injected with cdon MO and cdon mRNA, in respectively. Embryos injected with cdon MO show a statistically significant difference compared to controls, and embryos co-injected with cdon MO and cdon mRNA show a statistically significant difference compared to those injected with cdon MO alone. (D) Embryos injected with cdon MO displayed heart LR defects. d1, normal-loop in Tg(cmlc2:GFP) transgenic controls (97.4%, n = 77); d2, normal-loop in embryos injected with cdon MO (56.8%, n = 95); d3, no loop in embryos injected with cdon MO (16.8%, n = 95); d4, reversed-loop in embryos injected with cdon MO (26.4%, n = 95); d5, normal-loop in wild type controls (94.5%, n = 73); d6-d8, wild-type embryos injected with cdon MO at the 4-cell stage were examined for cardiac looping at 72 hpf by WISH against my17 (n = 83). The blue dashed line indicates the atrial edge. (E) Percentages of normal looping, no looping, and reversed looping of the heart in embryos being as control, embryos injected with cdon MO, and embryos co-injcted with cdon MO and cdon mRNA. Cdon mRNA injection partially rescued the heart LR defect in embryos injected with cdon MO (E, the right column showing). Embryos injected with cdon MO show a statistically significant difference compared to controls, and embryos co-injected with cdon MO and cdon mRNA show a statistically significant difference compared to those injected with cdon MO alone. Notice: in “C” and “E,” all the transgenic embryos and wild type embryos were used together to calculate the percentage. Statistical analysis was performed using Student’s t-test. “*”p < 0.05, “**” p < 0.01, “***” p < 0.001. Notice: “control” refers to wild-type embryos that were not injected with cdon MO. EXPRESSION / LABELING:
PHENOTYPE:
|
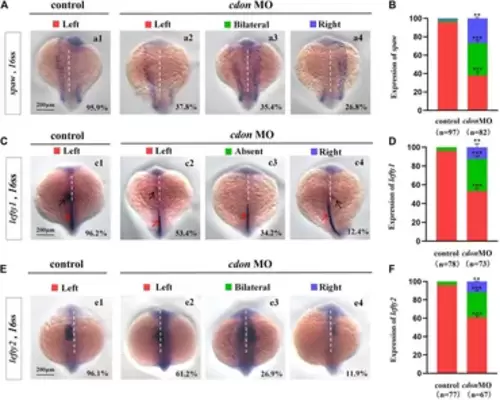
Expression of left-sided Nodal signaling in controls and embryos injected with cdon MO (A,B) Expression of spaw was evaluated in different groups of embryos. a1, left-sided spaw in controls (95.9%, n = 97); a2, left-sided spaw in embryos injected with cdon MO (37.8%, n = 82, p < 0.001); a3, bilateral spaw in embryos injected with cdon MO (35.4%, n = 82, p < 0.001); a4, right-sided spaw in embryos injected with cdon MO (26.8%, n = 82, p < 0.01). (C,D) Lefty1 is expressed in the heart field (black arrow) and trunk midline (red arrow) in controls and embryos injected with cdon MO. c1, left-sided lefty1 in embryos being as controls (96.2%, n = 78, black arrow showed); c2, left-sided lefty1 in embryos injected with cdon MO (53.4%, n = 73, p < 0.001, black arrow showed); c3, absent lefty1 in embryos injected with cdon MO (34.2%, n = 73, p < 0.001); c4, right-sided lefty1 in embryos injected with cdon MO (12.4%, n = 73, p < 0.01, black arrow showed) (E,F) Lefty2 is examined in control embryos and embryos injected with cdon MO. e1, left-sided lefty2 in controls (96.1%, n = 77); e2, left-sided lefty2 in embryos injected with cdon MO (61.2%, n = 67, p < 0.001); e3, bilateral expression of lefty2 in embryos injected with cdon MO (26.9%, n = 67, p < 0.001); e4, right-sided lefty2 in embryos injected with cdon MO (11.9%, n = 67, p < 0.01). Statistical analysis was performed using Student’s t-test. “**” p < 0.01, “***” p < 0.001. Notice: “control” refers to wild-type embryos that were not injected with cdon MO. EXPRESSION / LABELING:
PHENOTYPE:
|
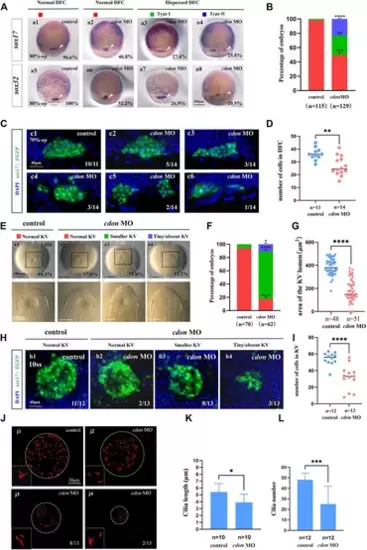
Cdon loss of function disturbs clustering DFCs, KV morphogenesis and cilia (A) Expression of sox17 and sox32 was examined using WISH at 80% epiboly (white arrow). a1, normal expression of sox17 in controls (96.6%, n = 58); a2, normal expression of sox17 in embryos injected with cdon MO at the 4-cell stage (46.8%, n = 62); a3, dispersed expression of sox17 (type I) in embryos injected with cdon MO at the 4-cell stage (27.4%, n = 62); a4, dispersed expression of sox17 (type II) in embryos injected with cdon MO at the 4-cell stage (25.8%, n = 62). a5, normal expression of sox32 in controls (100%, n = 57); a6, normal expression of sox32 in embryos injected with cdon MO at the 4-cell stage (52.2%, n = 67); a7, dispersed expression of sox32 (type I) in embryos injected with cdon MO at the 4-cell stage (26.9%, n = 67); a8, dispersed expression of sox32 (type II) in embryos injected with cdon MO at the 4-cell stage (20.9%, n = 67). (B) Statistical analysis was performed for the expression of sox17 and sox32 in controls and embryos injected with cdon MO. Here all the embryos staining with sox17 or sox32 were used together to calculate the percentage. Normal DFC and dispersed DFC show significant differences between control embryos and embryos injected with cdon MO at the 4-cell stage. (C) Using Tg (sox17:EGFP) transgenic zebrafish to detect DFC cell migration at the 70% epiboly stage in both control embryos and embryos injected with cdon MO at the 4-cell stage. c1, the DFCs in control embryos are tightly clustered (10/11, n = 11); c2, tightly clustered DFCs in embryos injected with cdon MO at the 4-cell stage (5/14, n = 14). c3, in embryos injected with cdon MO at the 4-cell stage, the DFCs are arranged in an elongated pattern with a reduced number of cells (3/14, n = 14). c4, mildly dispersed DFCs in embryos injected with cdon MO at the 4-cell stage (3/14, n = 14). c5, moderately dispersed DFCs in embryos injected with cdon MO at the 4-cell stage (2/14, n = 14). c6, in embryos injected with cdon MO at the 4-cell stage, the DFCs are dispersed, and the number of cells is significantly reduced (1/14, n = 14). (D) Number of cells in DFC in control and cdon MO-injected embryos. “n” represents the sample size. (E,F) KV morphology was evaluated. e1, normal KV in embryos in controls (94.3%, n = 70); e2, normal KV in embryos injected with cdon MO at the 4-cell stage (17.8%, n = 62, p < 0.001); e3, smaller KV in embryos injected with cdon MO at the 4-cell stage (71.0%, n = 62, p < 0.0001); e4, tiny/absent KV in embryos injected with cdon MO at the 4-cell stage (11.2%, n = 62, p < 0.05). “Normal KV” represents a KV lumen area greater than 300 μm2, “smaller KV” represents a KV lumen area between 100 and 300 μm2, and “tiny/absent KV” represents a KV lumen area less than 100 μm2. (G) Area of the KV lumen (µm2) in control and cdon MO-injected embryos. “n” represents the sample size. (H) The number of epithenium cells in KV were measured on confocal images. (I) Number of epithenium cells in KV in control and cdon MO-injected embryos. “n” represents the sample size. (J) Number and length of cilia were evaluated in controls and embryos injected with cdon MO. j1, cilia in embryos being as controls; j2-j4, cilia in embryos injected with cdon MO at the 4-cell stage. (K) Statistical chart for cilia length in KV. “n”represents the sample size. (L) Statistical chart for cilia number in KV. “n”represents the sample size. Statistical analysis was performed using Student’s t-test. “*” p < 0.05, “**” p < 0.01, “***” p < 0.001, “****” p < 0.0001. Notice: “control” refers to wild-type embryos that were not injected with cdon MO. EXPRESSION / LABELING:
PHENOTYPE:
|
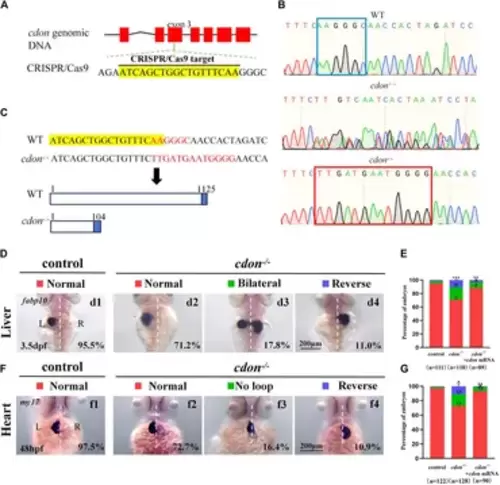
Organ LR patterning defects in cdon−/−embryos (A) CRISPR/Cas9 target was showed. The sequence in the exon 3 of cdon gene was chosen as the target (yellow highlighted). (B) Sequencing results for the genomic DNA in WT embryos, cdon+/− embryos and cdon−/− embryos. (C) Nucleotide sequences highlighted in yellow are CRISPR/Cas9 targets. In the cdon mutant, the sequence “AAGGGC” was changed to “TTGATGAATGGGG”. Cdon mutant harbors a frameshift mutation that is predicted to result in the production of truncated Cdon protein (104 amino acids). (D) Cdon−/− embryos were found to display liver LR defects using WISH. d1, left-sided liver in controls (95.5%, n = 111); d2, left-sided liver in cdon−/− embryos (71.2%, n = 118); d3, liver bifida in cdon−/− embryos (17.8%, n = 118); d4, right-sided liver in cdon−/− embryos (11.0%, n = 118). (E) Percentages of left-sided liver, liver bifida, and right-sided liver in cdon−/− embryos (n = 118), controls (n = 111) and cdon−/− embryos injected with cdon mRNA (n = 89), cdon−/− embryos show a statistically significant difference compared to controls, and cdon−/− embryos injected with cdon mRNA show a statistically significant difference compared to cdon−/− embryos. (F) Cdon−/− embryos displayed heart LR defects. f1, normal-loop heart in controls (97.5%, n = 122); f2, normal-loop heart in cdon−/− embryos (72.7%, n = 128); f3, no loop heart in cdon−/−embryos (16.4%, n = 128); f4, reversed loop heart in cdon−/− embryos (10.9%, n = 128). The blue dashed line indicates the atrial edge. (G) Percentages of normal looping, no looping, and reversed looping of the heart in cdon−/− embryos (n = 128), controls (n = 122) and cdon−/− embryos injected with cdon mRNA (n = 90), cdon−/− embryos show a statistically significant difference compared to controls, and cdon−/− embryos injected with cdon mRNA show a statistically significant difference compared to cdon−/− embryos. Statistical analysis was performed using Student’s t-test. “*” p < 0.05, “**” p < 0.01, “***” p < 0.001. Notice: “control” refers to wild-type embryos. EXPRESSION / LABELING:
PHENOTYPE:
|
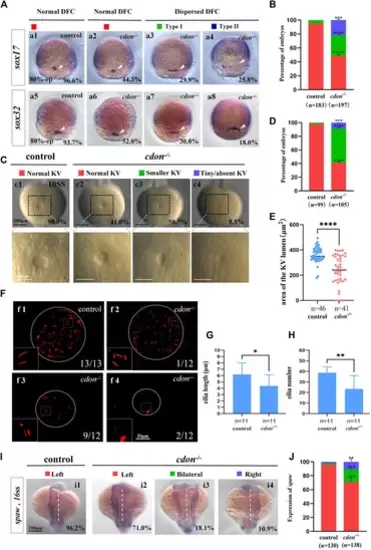
Cdon mutation gave rise to defects in KV formation and cilia (A) Expression of sox17 and sox32 was examined using WISH at 80% epiboly. a1, normal expression of sox17 in controls (96.6%, n = 88); a2, normal expression of sox17 in cdon−/− embryos (44.3%, n = 97); a3, dispersed expression of sox17 (type I) in cdon−/− embryos (29.9%, n = 97); a4, dispersed expression of sox17 (type II) in cdon−/− embryos (25.8%, n = 97). DFCs (white arrow). a5, normal expression of sox32 in controls (93.7%, n = 95); a6, normal expression of sox32 in cdon−/− embryos (52.0%, n = 100); a7, dispersed expression of sox32 (type I) in cdon−/− embryos (30%, n = 100); a8, dispersed expression of sox32 (type II) in cdon−/− embryos (18.0%, n = 100). DFCs (white arrow). (B) Statistical analysis was performed for DFCs clustering migration in controls (n = 183) and cdon−/− embryos (n = 197). Here all the embryos staining with sox17 or sox32 were used together to calculate the percentage. Normal DFC and dispersed DFC show significant differences between control embryos and cdon−/− embryos (C,D) Morphology of KV in different group of embryos at 10sss. c1, normal KV in controls (98.0%, n = 99); c2, normal KV in cdon−/− embryos (41.0%, n = 105, p < 0.0001); c3, smaller KV in cdon−/− embryos (50.5%, n = 105, p < 0.0001); c4, tiny/absent KV in cdon−/− embryos (8.5%, n = 105, p < 0.001). “Normal KV” represents a KV lumen area greater than 300 μm2, “smaller KV” represents a KV lumen area between 100 and 300 μm2, and “tiny/absent KV” represents a KV lumen area less than 100 μm2. (E) Area of the KV lumen (µm2) in control and cdon−/− embryos. “n” represents the sample size. (F) The number and the length of cilia were examined at 10 sss. f1, cilia in controls; f2-f4, cilia in cdon−/− embryos (G) Statistical chart for cilia length in KV. “n” represents the sample size. (H) Statistical chart for cilia number in KV. “n” represents the sample size. (I,J) Expression of spaw in controls and cdon−/− embryos. i1, left-sided spaw in controls (96.2%, n = 130); i2, left-sided spaw in cdon−/− embryos (71.0%, n = 138, p < 0.001); i3, bilateral spaw in cdon−/− embryos (18.1%, n = 138, p < 0.001); i4,right-sided spaw in cdon−/− embryos (10.9%, n = 138, p < 0.01). Statistical analysis was performed using Student’s t-test. “*” p < 0.05, “**” p < 0.01, “***” p < 0.001, “****” p < 0.0001. Notice: “control” refers to wild-type embryos. EXPRESSION / LABELING:
PHENOTYPE:
|
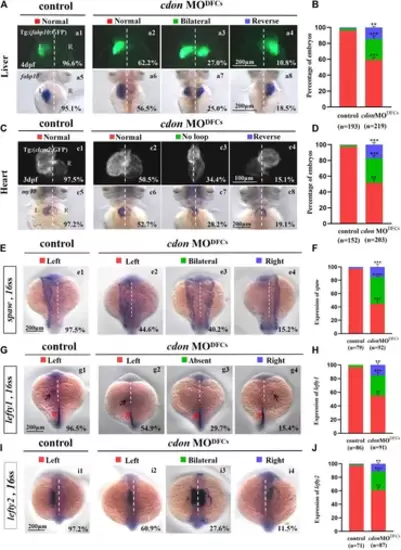
Organ left-right patterning defects in embryos injected with cdon MO at the 256-cell stage (A) Embryos injected with cdon MO at the 256-cell stage were found to cause liver LR defects. a1, normal liver in Tg(fabp10:GFP) transgenic controls (96.6%, n = 90); a2, normal liver in Tg(fabp10:GFP) transgenic embryos injected with cdon MO at the 256-cell stage (62.2%, n = 111); a3, liver bifida in Tg(fabp10:GFP) transgenic embryos injected with cdon MO at the 256-cell stage (27.0%, n = 111); a4, reversed liver in Tg(fabp10:GFP) transgenic embryos injected with cdon MO at the 256-cell stage (10.8%, n = 111). a5, normal liver in wild-type controls (95.1%, n = 103); a6-a8, wild-type embryos injected with cdon MO at the 256-cell stage were examined for liver laterality at 4 dpf by WISH against fabp10 probe (n = 108). (B) Percentages of normal liver, liver bifida, and reversed liver in control embryos and embryos injected with cdon MO at the 256-cell stage. Embryos injected with cdon MO at the 256-cell stage show a statistically significant difference compared to controls. (C) Heart morphogenesis in Tg(cmcl2:GFP) transgenic embryos and wild-type embryos injected with cdon MO at the 256-cell stage. c1, normal-loop in Tg(cmcl2:GFP) transgenic controls (97.5%, n = 80); c2, normal-loop in Tg(cmcl2:GFP) transgenic embryos injected with cdon MO at the 256-cell stage (50.5%, n = 93); c3, no loop in Tg(cmcl2:GFP) transgenic embryos injected with cdon MO at the 256-cell stage (34.4%, n = 93); c4, reversed-loop in Tg(cmcl2:GFP) transgenic embryos injected with cdon MO at the 256-cell stage (15.1%, n = 93); c5, normal-loop in wild type controls (97.2%, n = 72); c6-c8, wild-type embryos injected with cdon MO at 256-cell stage were examined for cardiac looping at 72 hpf by WISH against my17 (n = 110). The blue dashed line indicates the atrial edge. (D) Percentages of normal looping, no looping, and reversed looping of the heart in all the embryos injected with or without cdon MO at the 256-cell stage. Embryos injected with cdon MO at the 256-cell stage show a statistically significant difference compared to controls. (E,F) Expression of Nodal/spaw in controls (n = 79) and embryos injected with cdon MO at the 256-cell stage (n = 92). (G,H) Expression of lefty1 in controls (n = 86) and embryos injected with cdon MO at the 256-cell stage (n = 91). (I,J) Expression of lefty2 in controls (n = 71) and embryos injected with cdon MO at the 256-cell stage (n = 87). Statistical analysis was performed using Student’s t-test. “**” p < 0.01, “***” p < 0.001, “****” p < 0.0001. Notice: in “B” and “D”, all the transgenic embryos and wild-type embryos were used together to calculate the percentage. “Control” refers to wild-type embryos that were not injected with cdon MO. EXPRESSION / LABELING:
PHENOTYPE:
|