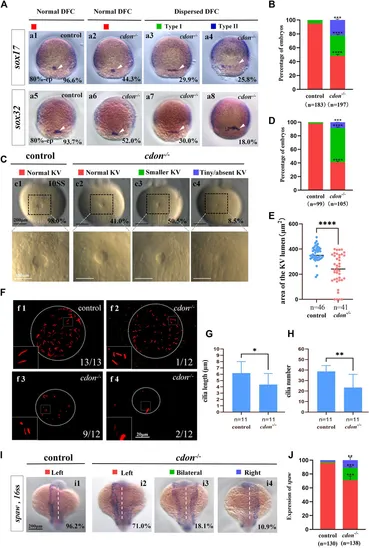
Fig. 5 Cdon mutation gave rise to defects in KV formation and cilia (A) Expression of sox17 and sox32 was examined using WISH at 80% epiboly. a1, normal expression of sox17 in controls (96.6%, n = 88); a2, normal expression of sox17 in cdon−/− embryos (44.3%, n = 97); a3, dispersed expression of sox17 (type I) in cdon−/− embryos (29.9%, n = 97); a4, dispersed expression of sox17 (type II) in cdon−/− embryos (25.8%, n = 97). DFCs (white arrow). a5, normal expression of sox32 in controls (93.7%, n = 95); a6, normal expression of sox32 in cdon−/− embryos (52.0%, n = 100); a7, dispersed expression of sox32 (type I) in cdon−/− embryos (30%, n = 100); a8, dispersed expression of sox32 (type II) in cdon−/− embryos (18.0%, n = 100). DFCs (white arrow). (B) Statistical analysis was performed for DFCs clustering migration in controls (n = 183) and cdon−/− embryos (n = 197). Here all the embryos staining with sox17 or sox32 were used together to calculate the percentage. Normal DFC and dispersed DFC show significant differences between control embryos and cdon−/− embryos (C,D) Morphology of KV in different group of embryos at 10sss. c1, normal KV in controls (98.0%, n = 99); c2, normal KV in cdon−/− embryos (41.0%, n = 105, p < 0.0001); c3, smaller KV in cdon−/− embryos (50.5%, n = 105, p < 0.0001); c4, tiny/absent KV in cdon−/− embryos (8.5%, n = 105, p < 0.001). “Normal KV” represents a KV lumen area greater than 300 μm2, “smaller KV” represents a KV lumen area between 100 and 300 μm2, and “tiny/absent KV” represents a KV lumen area less than 100 μm2. (E) Area of the KV lumen (µm2) in control and cdon−/− embryos. “n” represents the sample size. (F) The number and the length of cilia were examined at 10 sss. f1, cilia in controls; f2-f4, cilia in cdon−/− embryos (G) Statistical chart for cilia length in KV. “n” represents the sample size. (H) Statistical chart for cilia number in KV. “n” represents the sample size. (I,J) Expression of spaw in controls and cdon−/− embryos. i1, left-sided spaw in controls (96.2%, n = 130); i2, left-sided spaw in cdon−/− embryos (71.0%, n = 138, p < 0.001); i3, bilateral spaw in cdon−/− embryos (18.1%, n = 138, p < 0.001); i4,right-sided spaw in cdon−/− embryos (10.9%, n = 138, p < 0.01). Statistical analysis was performed using Student’s t-test. “*” p < 0.05, “**” p < 0.01, “***” p < 0.001, “****” p < 0.0001. Notice: “control” refers to wild-type embryos.
Image
Figure Caption
Figure Data
Acknowledgments
This image is the copyrighted work of the attributed author or publisher, and
ZFIN has permission only to display this image to its users.
Additional permissions should be obtained from the applicable author or publisher of the image.
Full text @ Front Cell Dev Biol

